Raivin Web UI Walkthrough
This article will walk you through the Raivin's Web User Interface (Web UI). The Web UI is served by the websrv service on the device over HTTP and HTTPS and is reached at https://verdin-imx8mp-XXXXXXXX.local where the eight digits are the device serial number.
The Main Page
The Main Page of the Raivin web interface should look as follows:
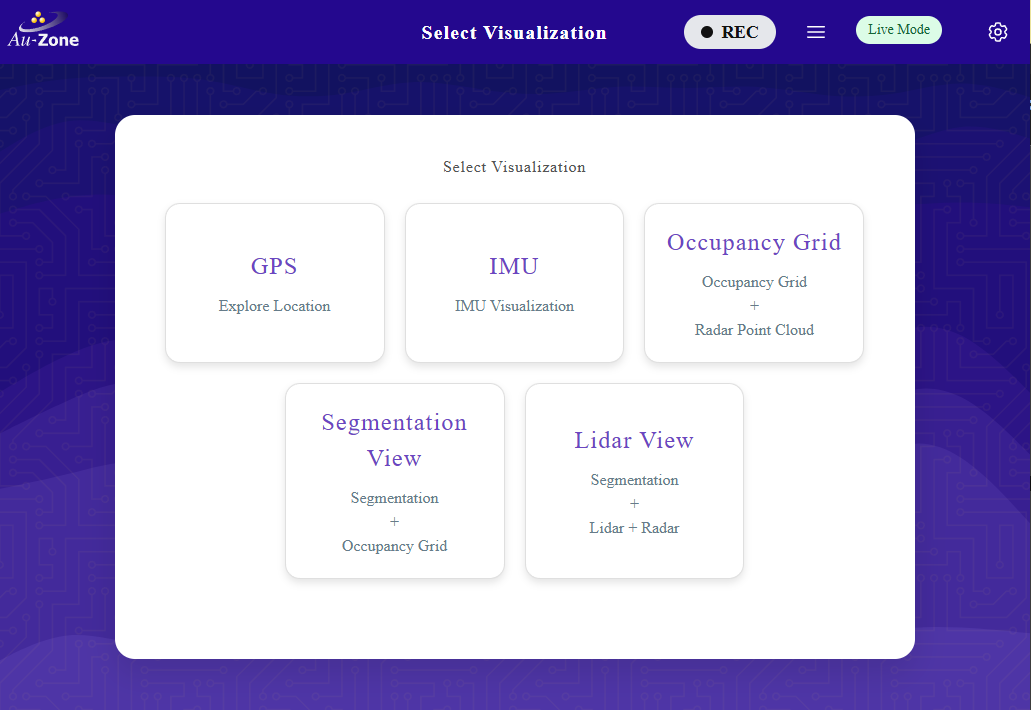
The Main Page shows one card for each running visualization. Cards only appear while their service is running, so a Raivin with the radar publisher enabled shows the following cards:
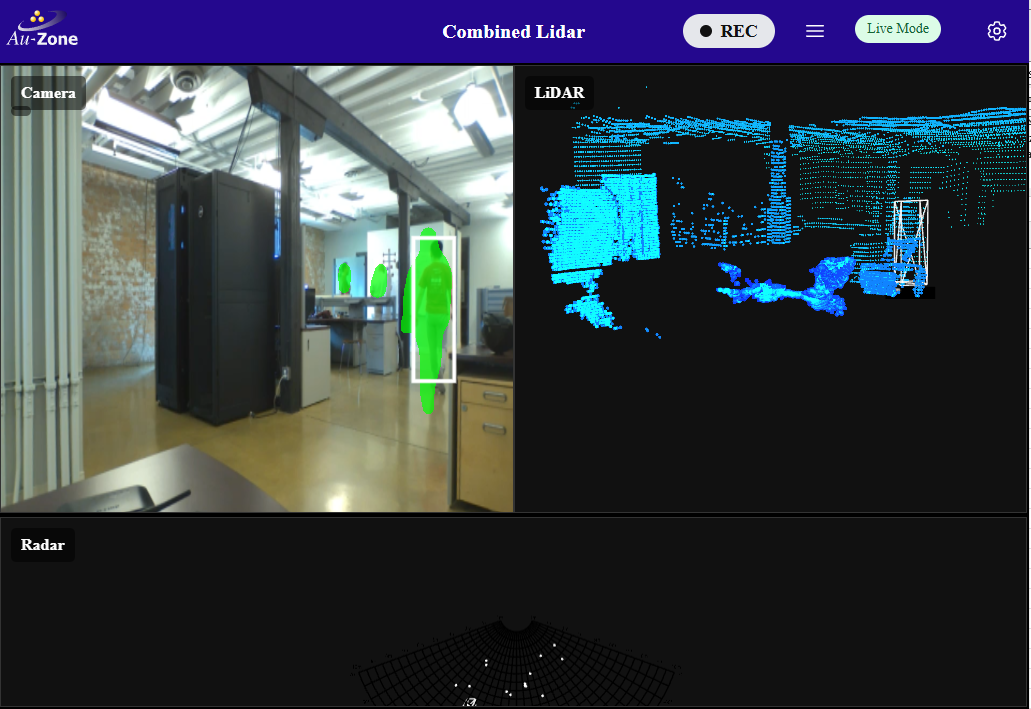
- Camera: This page shows the live camera video with optional detection and segmentation overlays from the model service and, for LiDAR equipped devices, the projected LiDAR points.
- Radar: This page shows the radar point cloud over a polar occupancy grid.
- LiDAR: This page shows the 3D LiDAR point cloud, it appears when the LiDAR publisher is running.
- IMU: This page displays the 3D orientation of the device with current roll, pitch, and yaw values.
- GPS: This page displays a map with the current location of the device, along with GPS coordinates.
The Top Ribbon
The ribbon at the top of the web interface is available on every page of the web interface. The following elements are available on every page of the device's web interface.
- On the left, the "Home" button with the Au-Zone icon, which will return the user to the Main Page
- In the middle, the title of the current page
- On the right side, we first have the Recording Indicator, shown as a gray oval with "REC" when not recording from the sensors and a red oval when recording
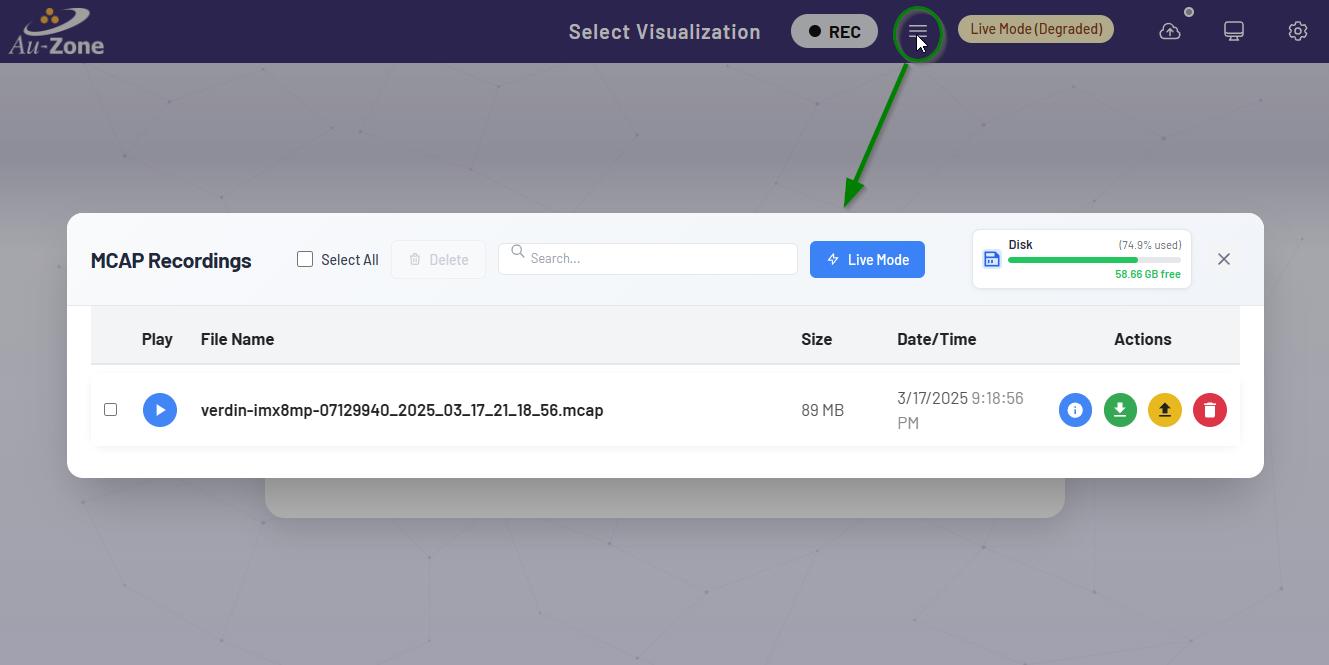
- The MCAP Details Modal button, which opens the MCAP Modal
- The EdgeFirst Studio button, which shows whether the device is logged in to EdgeFirst Studio and opens the login dialog used for uploading recordings
- The System Status Indicator and Dropdown button
- The theme toggle switching the interface between light, dark, and automatic modes
- The farthest rightmost button, with the gear icon, is the Settings Button which will take you to the Settings Page
Notifications such as the outcome of saving a configuration page or starting a recording appear as cards below the ribbon. Errors stay until dismissed while informational notifications clear on their own.
The MCAP Modal
The MCAP Modal is the interface to manage MCAP recordings, including getting information about recorded MCAP files, disk usage, deletion, downloading files, uploading files to EdgeFirst Studio, and replaying files on the device. More information about the MCAP Modal and recording MCAPs is in the Recording section
System Status Indicator
Mousing over the System Status Indicator field will give a brief summary of any problems.
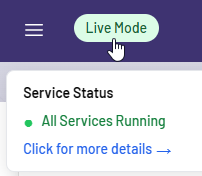
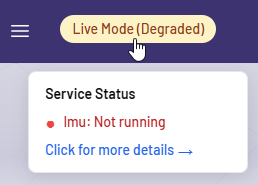
More on these status can be found in the Status Monitoring section.
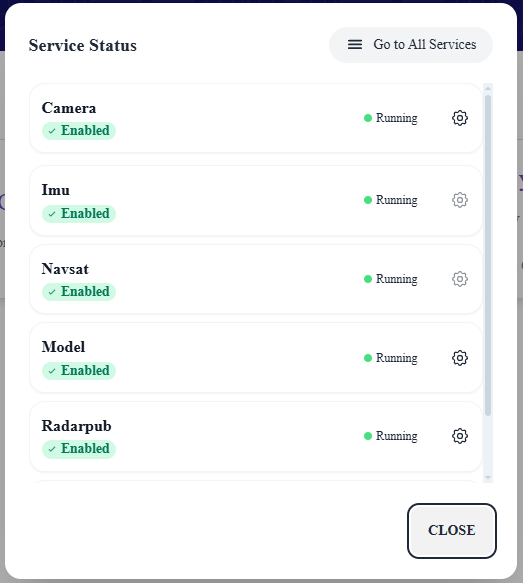
Clicking on the indicator will bring up the Service Status Modal, which contains a list of services and, if available, clickable gear icons that link to the service's configuration page.
The Visualization Pages
These pages contain the user-facing functionality of the vision module.
The Camera Page
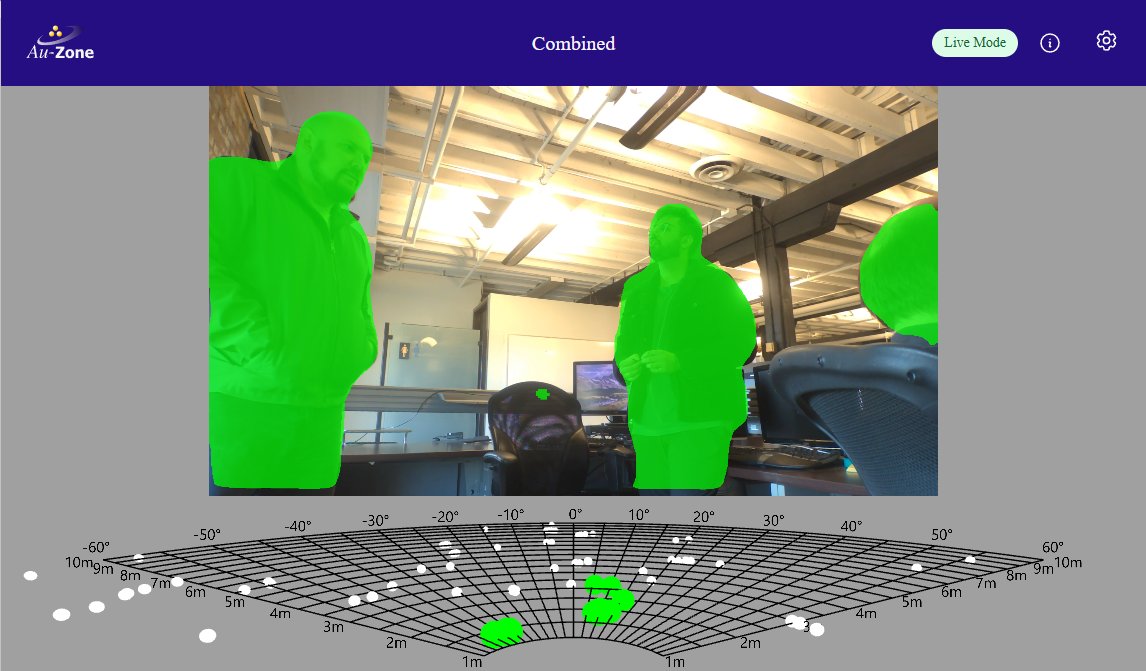
The Camera page shows the live camera video decoded from the camera/h264 topic. The controls at the top of the page toggle the segmentation overlay, which draws the detection boxes and segmentation masks published by the model service on model/output over the video, and the LiDAR overlay which projects the LiDAR points onto the image colored by distance, cluster, or the classes assigned by the fusion service.
The Radar Page
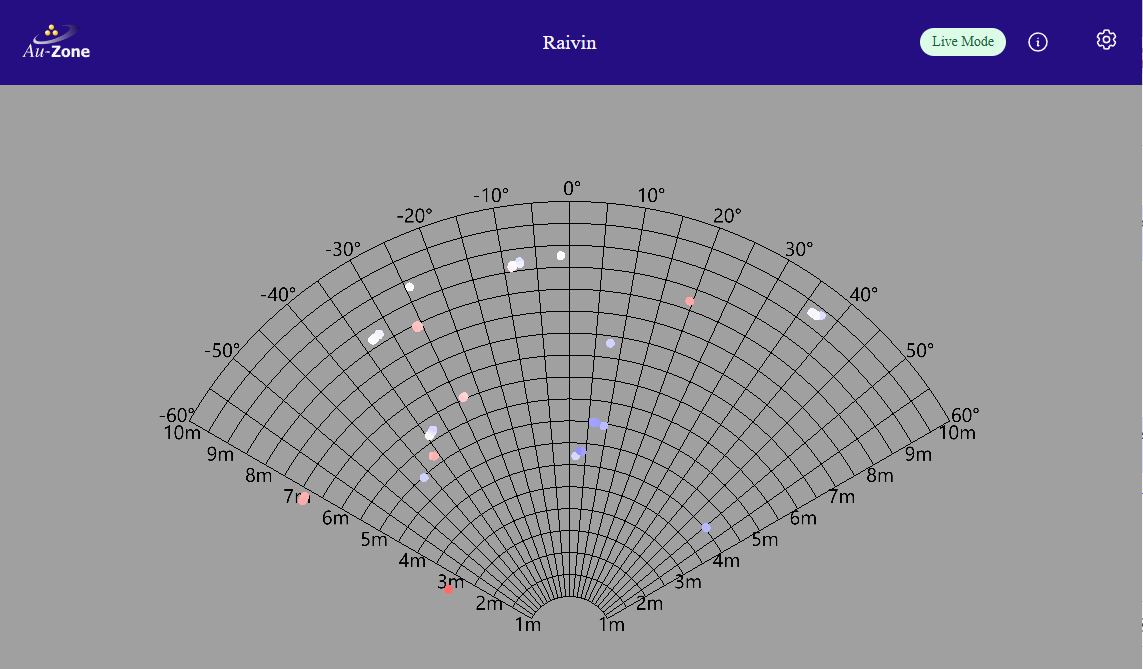
The Radar page shows the radar point cloud on a polar grid spanning 140 degrees in front of the device with range rings every two meters. The Source dropdown selects between the raw radar targets, the radar clusters, and the fusion radar output. The Color dropdown colors the points by speed, power, radar cross-section (RCS), cluster, vision class, track ID, or instance ID depending on the fields carried by the selected stream, and the Elevation toggle lifts the points off the grid plane by their height. A "Radar Unavailable" overlay is shown when the selected stream is not publishing.
The GPS Page
The GPS page shows an interactive map centered on the device's location as published by the NavSat service on the gps topic.
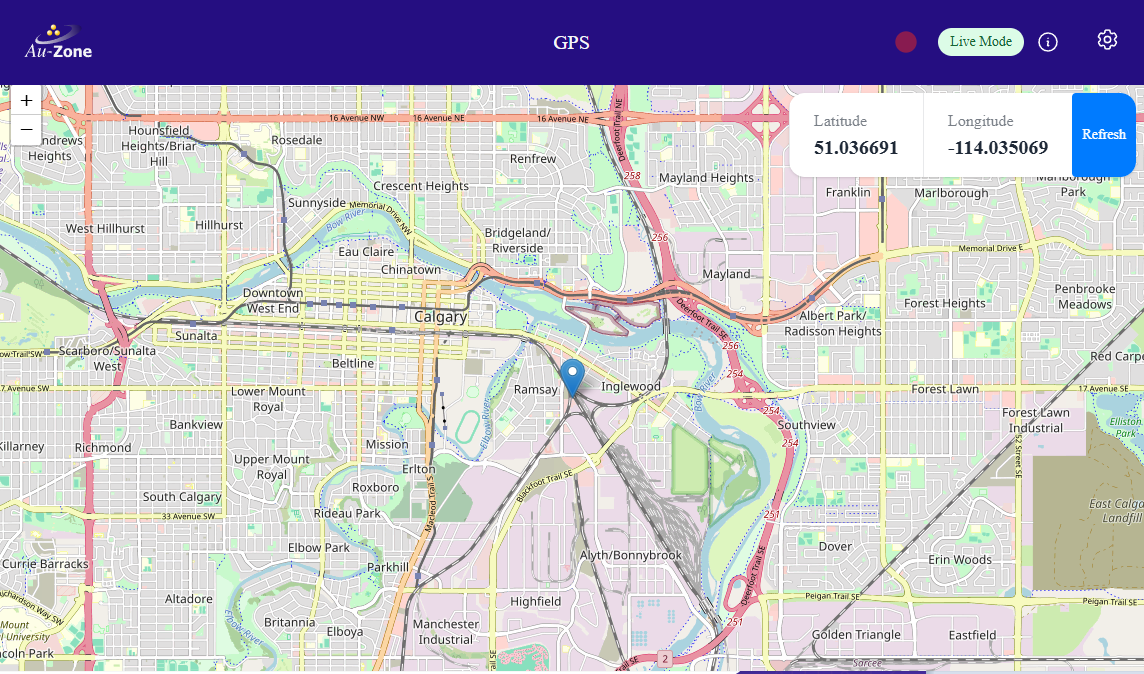
This should be familiar to anyone who has used standard map web interfaces. The map can be moved by dragging with left-mouse button (or touch with a touchscreen-enabled device). The "+" and "-" buttons on the left will zoom-in and zoom-out on the map. The "Refresh" button will re-center the map on the device's location. The latitude and longitude are also reported on the web interface. The map tiles are loaded from the Internet, the position readout works without connectivity.
The IMU Page
The IMU page shows the device's orientation in 3D as published by the IMU service on the imu topic.
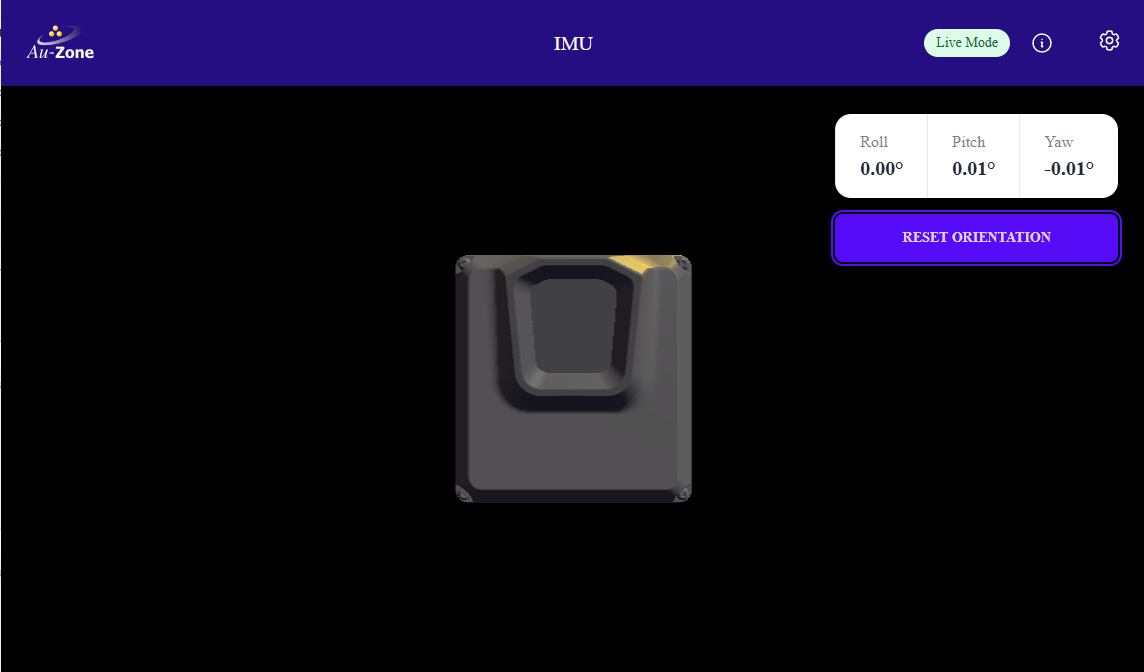
By physically moving the device, it's virtual counterpart should move the same way. Roll, pitch, and yaw values are reported. If the device's virtual orientation does not match the physical orientation, keep the device's bottom flat and hit the "Reset Orientation" button.
The LiDAR Page
This page shows the 3D LiDAR point cloud from the lidar/points topic with the same Source, Color, and Elevation controls as the Radar page, including coloring by the vision classes from the fusion service. The page is available when the LiDAR publisher is running.
Next Steps
Now that you have set up your Raivin and are familiar with the Raivin's Web UI, you can proceed to copying a public dataset in EdgeFirst Studio to train your own vision model that will be deployed in this device.