LiDAR Module
The Raivin configuration includes optional support for LiDAR sensors which provide high-resolution 3D point cloud data useful for creating ground-truth annotations. The LiDAR publishing service supports two sensor families:
- The Robosense E1R solid-state LiDAR, which is the default sensor type of the LiDAR service. Calibration profiles for mounting the E1R on the Maivin are provided and the sensor's built-in IMU enables the ground plane filter of the LiDAR service.
- The Ouster OS1-64 LiDAR sensor spinning LiDAR. A mounting kit for the Ouster is available from Au-Zone to attach the Raivin to the Ouster and calibration profiles for this mounting configuration are provided.
The LiDAR sensor is connected to the Raivin's sensor Ethernet port, providing both data communication and power over Ethernet (PoE) capabilities. The sections below describe the Ouster OS1 configuration.
Specifications
The Ouster OS1-64 is a high-resolution imaging LiDAR sensor with the following key specifications:
- Range:
- 100m @ >90% detection probability (80% Lambertian reflectivity)
- 45m @ >90% detection probability (10% Lambertian reflectivity)
- Field of View:
- Vertical: 45° (+22.5° to -22.5°)
- Horizontal: 360°
- Resolution:
- Vertical: 64 channels
- Horizontal: Configurable (512, 1024, or 2048 points per rotation)
- Data Rate: 129 Mbps (64 channel mode)
- Points Per Second: 1,310,720 (64 channel mode)
- Rotation Rate: 10 or 20 Hz (configurable)
- Power Consumption: 14-20W (22W peak at startup)
- Operating Voltage: 22-26V, 24V nominal
A full set of the LiDAR sensor specifications can be found in the Ouster OS1 datasheet.
Ouster Studio
Ouster Studio is a free digital LiDAR visualizer available for both web and desktop platforms. It provides a comprehensive solution for viewing, organizing, and sharing LiDAR point cloud data captured by Ouster OS series sensors. Download the Ouster Studio
Desktop Application
- Live streaming and recording of LiDAR data
- Real-time visualization
- Sensor discovery and configuration
- Cloud integration for data uploading and sharing
Sensor configuration
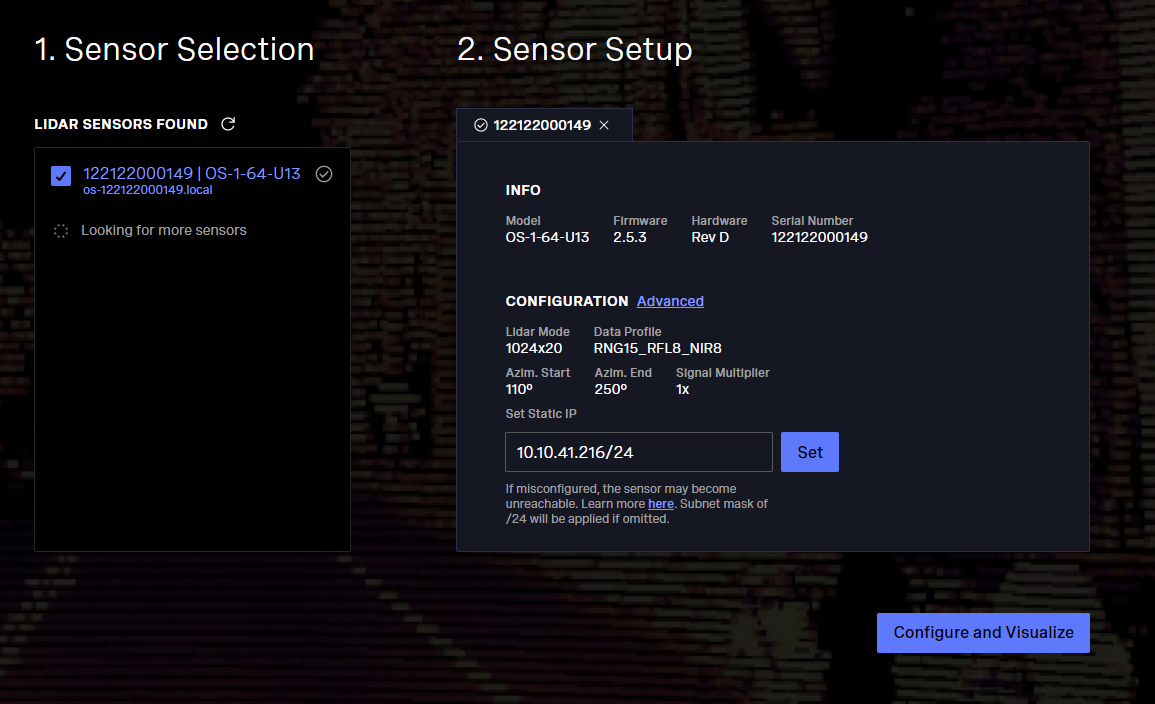
Once you have downloaded Ouster Studio it can be used get the device name as well as make modifications to the Static IP of the device. It is recommended that the user sets a static ip as shown in the image below.
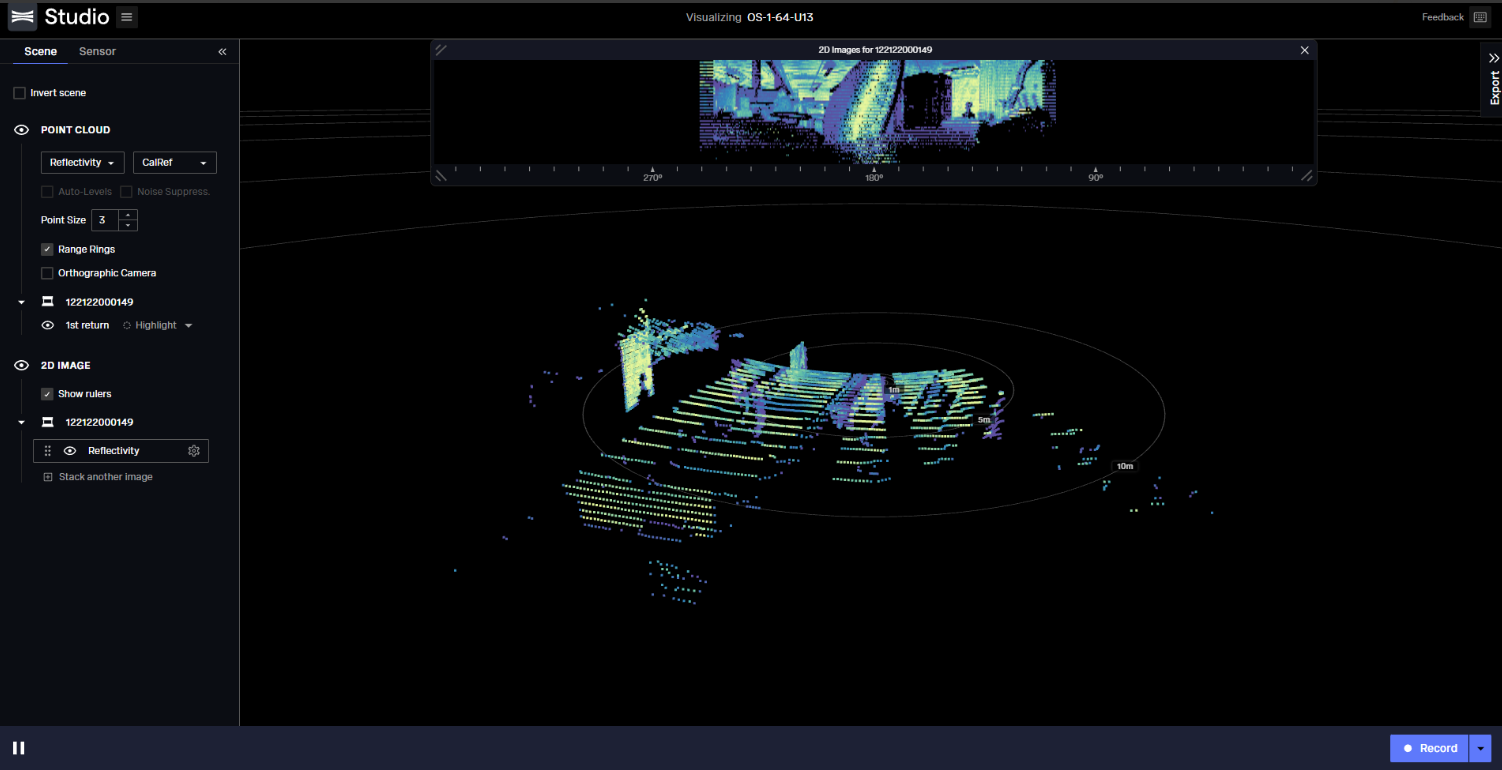
After making all the changes required you can hit "Configure and Visualize" and it will show a LiDAR PCD as follow
Networking
The LiDAR connects to the Raivin's ethernet1 sensor port which is managed by NetworkManager. The ethernet1-lidar connection profile assigns the static address 192.168.1.102/24 to the port, configure the LiDAR with a static address on the same subnet and set it as the Target Device of the LiDAR service. The profile is not active by default as the port is shared with the radar module, activate it when provisioning the LiDAR.
sudo nmcli connection down ethernet1-radar
sudo nmcli connection up ethernet1-lidar
The Raivin runs a PTP grandmaster on the sensor port, so the LiDAR can be configured to synchronize its clock to the Raivin by selecting the ptp1588 timestamp mode. Refer to Networking for details.
Firmware Requirements
The sensor should be running firmware version v2.5.3 or later. The sensor's local information page can be accessed at:
http://os-<serial_number>.local/
Data Format
The LiDAR sensor outputs data in the following formats:
- MCAP files for recorded data
- PCAP files for recorded data
- Live UDP stream over Ethernet
Each point in the point cloud contains:
- Range
- Signal
- Reflectivity
- Near-infrared
- Channel
- Azimuth angle
- Timestamp
Configuration
Azimuth Orientation
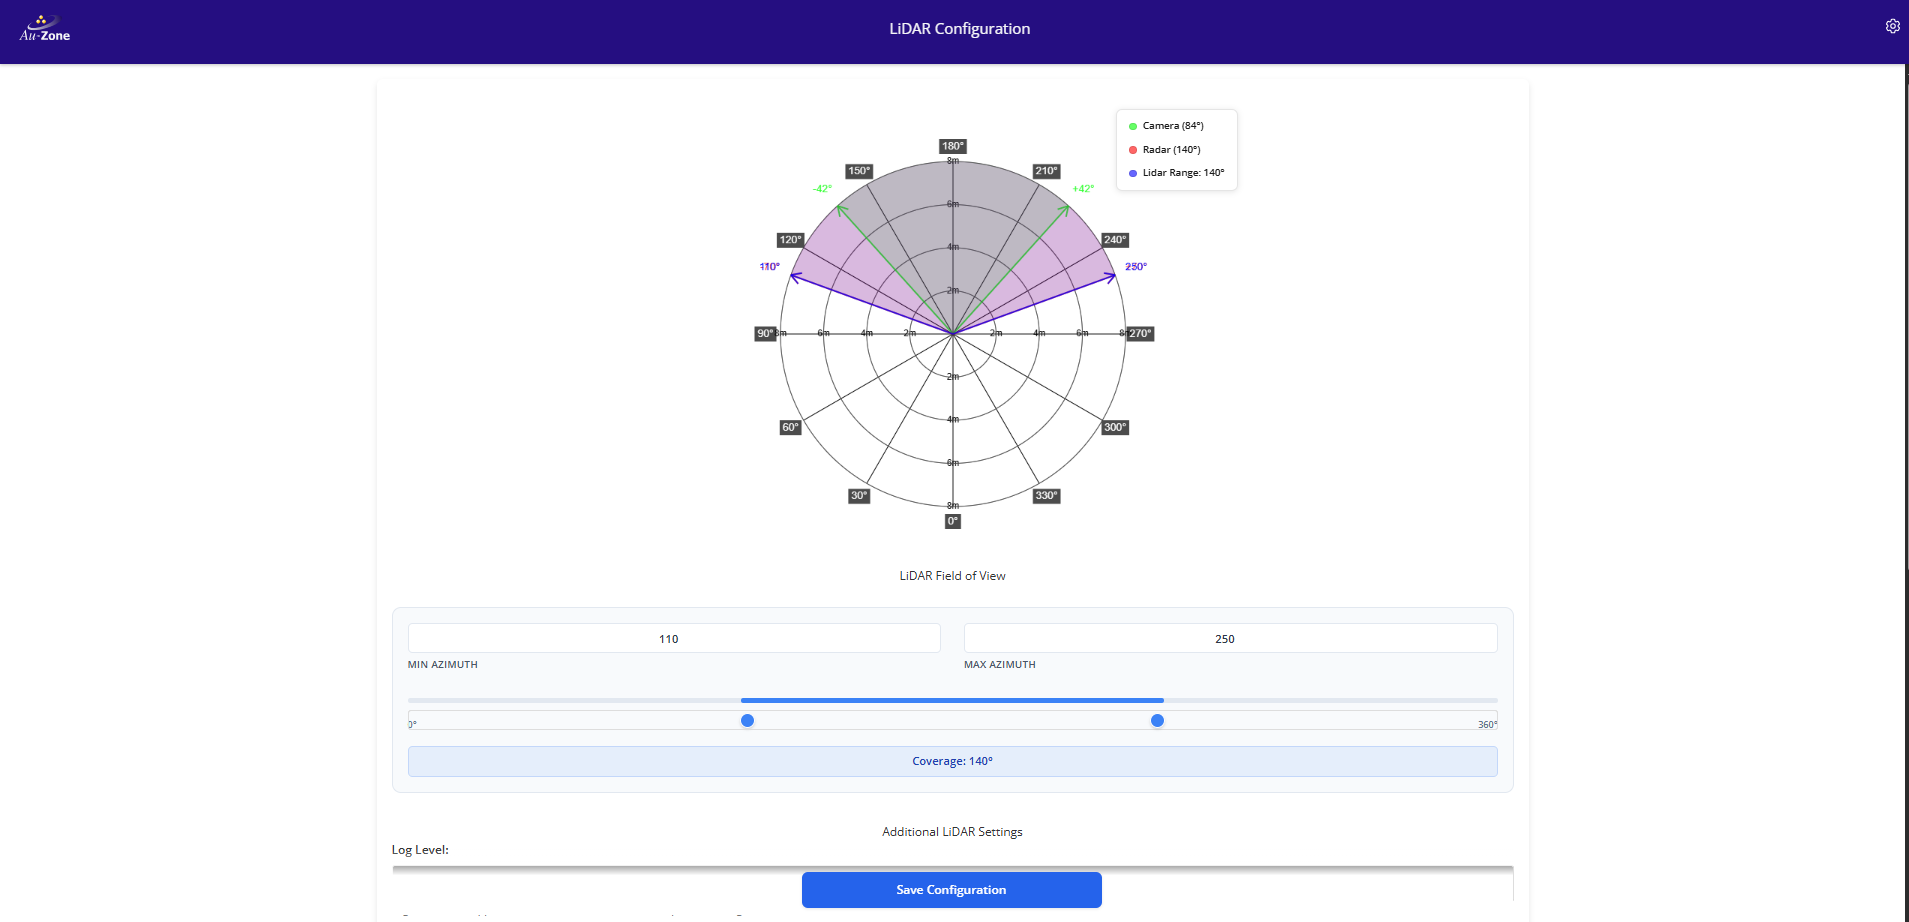
The 0° azimuth angle aligns with the RJ45 Ethernet connector on the Ouster OS1 sensor. Azimuth angles increase counterclockwise when viewed from above:
- 0°: Towards the Ethernet connector
- 90°: A quarter turn counterclockwise
- 180°: Opposite the connector
- 270°: Three-quarters counterclockwise from the connector
The LiDAR settings can be configured using the Web UI LiDAR Settings page
Data Visualization
The LiDAR data can be visualized using:
- Raivin Web UI LiDAR page for both live and recorded MCAPs
- Rerun visualization tool for both PCAP files and live data
- Ouster Studio for live or recorded data