Validation from the Profiler
The profiler's F2 Studio screen exposes the same project / experiment / training-session / artifact hierarchy you see in the EdgeFirst Studio web UI, plus the actions needed to create a validation session in place — without round-tripping through the browser. This flow is the fastest path from "I have a board running the profiler" to "I have published validation results in Studio".
When to use this flow
- The model you want to validate already lives in a Studio training session.
- You are working on the target board and want to avoid switching to a desktop browser.
- You want to spin up several quick validation runs (different artifacts, different confidence thresholds) without creating each session by hand.
For the classic flow — where the session is created in Studio first — see Validation from Studio.
Walkthrough
1. Open the F2 Studio screen
Launch the TUI, press F2. If you are not signed in, the login form appears first — see Connecting to EdgeFirst Studio.
Once signed in the screen shows the Projects explorer.
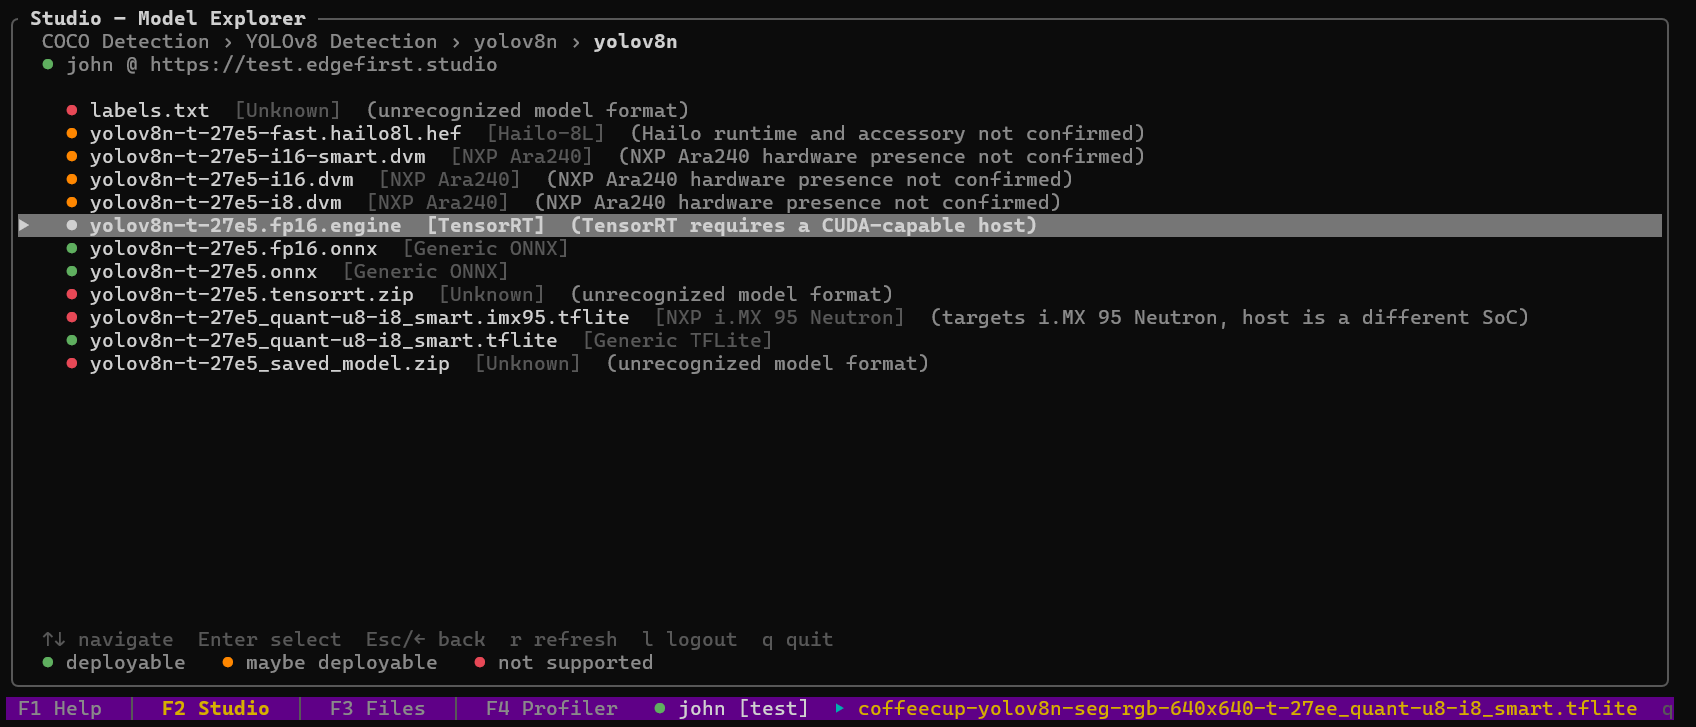
2. Navigate to a training session
Use ↑ / ↓ to move and Enter to drill down:
Projects → Experiments → Training Sessions → Artifacts
Each level renders the same metadata you see in the Studio web UI: project owner, last update, experiment status, training-session metrics. The breadcrumb across the top tracks where you are.
Backspace (or Esc) goes one level up. Quit-on-Esc is disabled inside the explorer so you cannot accidentally lose your place.
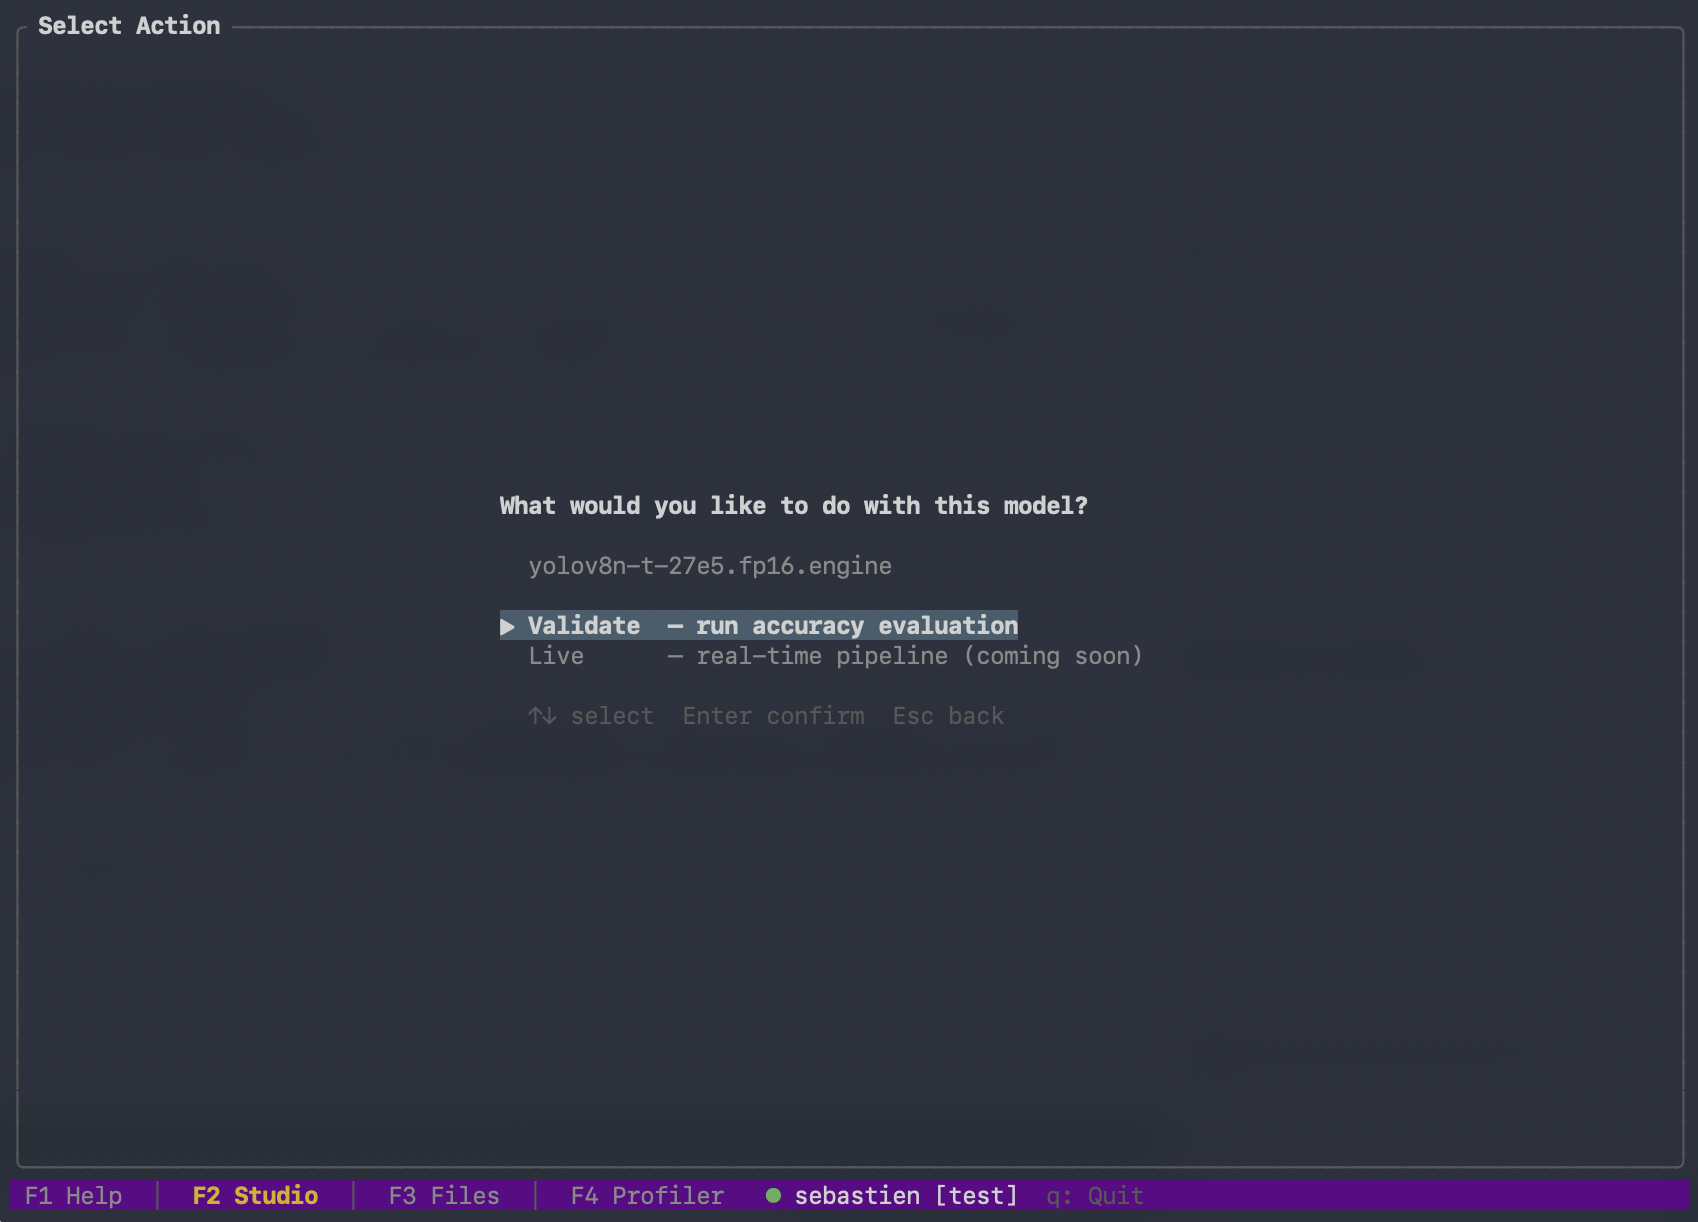
3. Pick an artifact and an action
When you select an artifact (e.g., best.onnx, best.tflite, best.engine), an action menu pops up:
| Action | Behavior |
|---|---|
| Validate | Create a new validation session bound to this artifact and the training session's dataset, then jump to the F4 Profiler screen to run it. |
| Live | (reserved) Stream live inference back to Studio rather than producing a validation session — covered in a future release. |
Choosing Validate opens an inline configuration panel: dataset partition, confidence threshold, IoU threshold, top-K, max detections. Sensible defaults are pre-filled from the training session.
Validation sessions need a writable project
Creating a validation session requires write access to the Studio project. The profiler cannot create a session against the read-only public Sample Project — first copy its dataset into a project you own (and add your model), then create the training and validation session there. (On a read-only or public project, a --training-session run falls back to local-only mode automatically — see CLI equivalent below.)
4. Confirm and run
Submit the configuration. The profiler:
- Calls Studio to create the validation session (returns a
v-XXXXID). - Downloads any artifacts that are not already cached.
- Switches to the F4 Profiler screen and starts the run automatically.
Before the dashboard starts, the profiler downloads any dataset frames that are not already cached. The TUI shows a progress panel during the download:
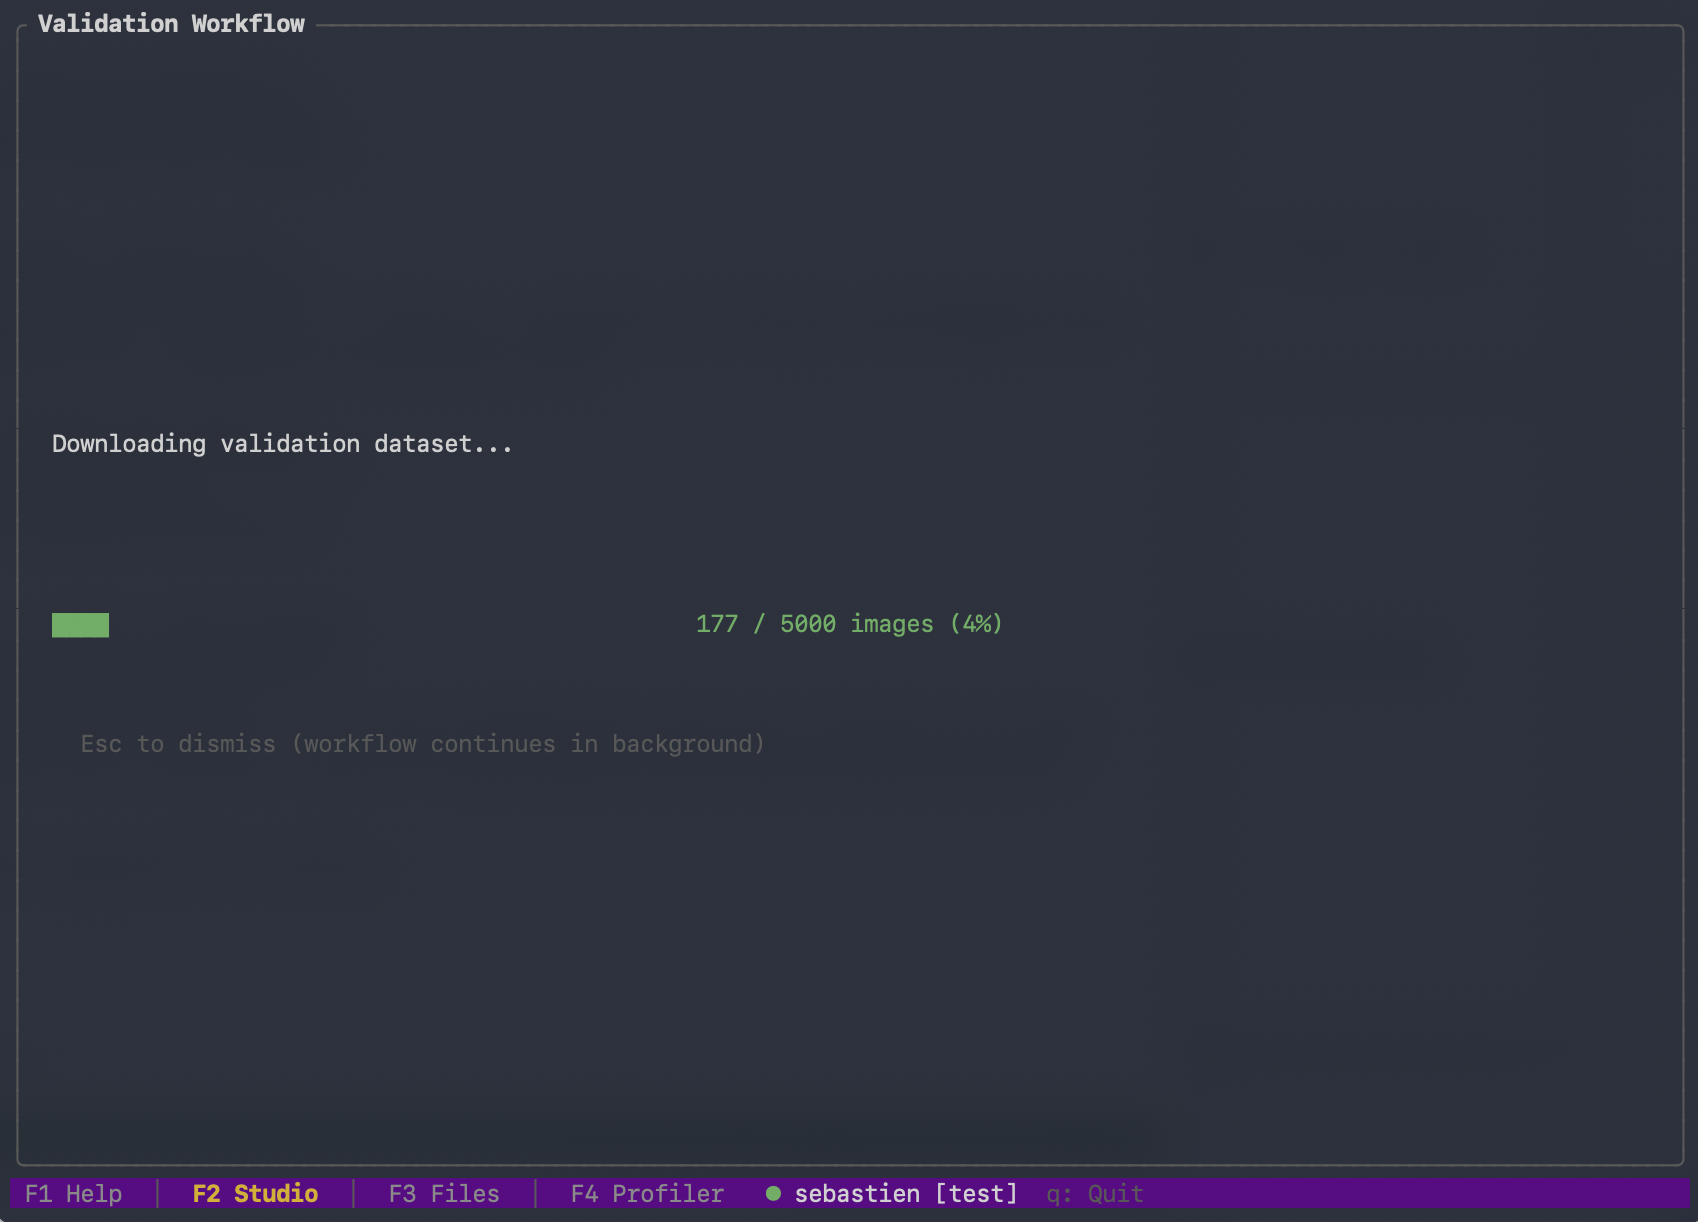
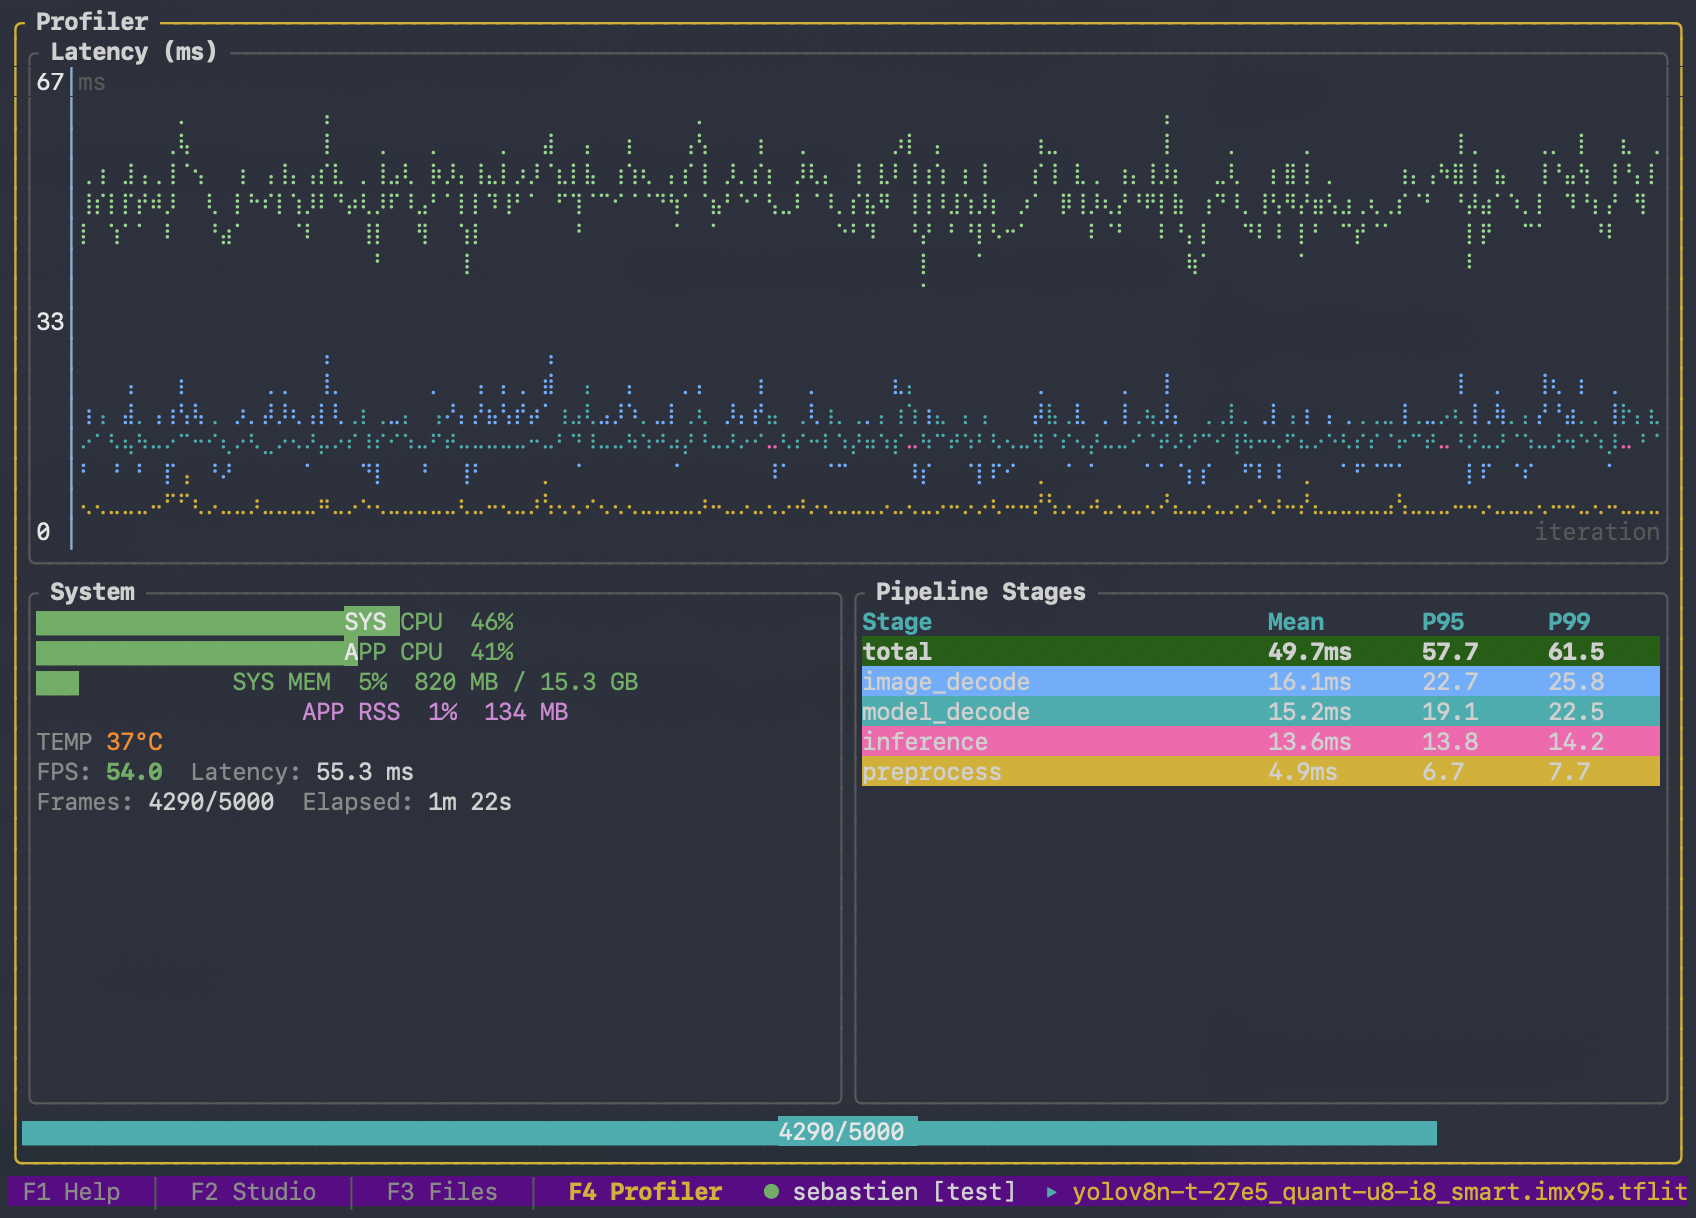
Once the dataset is local, the status bar shows the new session ID and the F4 dashboard streams iteration-level latency, system metrics, and per-stage timing as the pipeline executes:
5. Publishing and the cloud validator
Publish is automatic for sessions created from the F2 flow — the run uploads predictions.parquet and trace.pftrace to Studio and triggers the cloud validator on completion. The session ID is preserved in the run output directory (./results/<v-XXXX>/) so you can re-publish or re-run from the CLI later if you need to.
To skip the upload (e.g., when investigating a one-off timing question and the accuracy numbers are not interesting), use the configuration panel's Publish: off toggle before starting the run.
CLI equivalent
The TUI flow is convenient, but the same effect is reachable from the CLI when you already know the artifact you want:
edgefirst-profiler validate --training-session t-abc123
The profiler creates the validation session itself, downloads best.onnx (the first .onnx artifact, by default), runs the pipeline, and publishes the results. Specify a particular artifact name with --model:
edgefirst-profiler validate \
    --training-session t-abc123 \
    --model best.tflite
--training-session produces a brand-new validation session every time it is run; pass --session-id v-XXXX instead to re-publish to an existing session.
To profile locally without creating a Studio session — useful for a quick one-off timing check — pass --no-publish:
edgefirst-profiler validate --training-session t-abc123 --no-publish
The run writes predictions.parquet and trace.pftrace to disk and skips both session creation and the cloud validator. This is the CLI equivalent of the F2 panel's Publish: off toggle. On a read-only or public project — where the profiler cannot create a session — a --training-session run falls back to this local-only behavior automatically.
When the run completes
The completion summary in the TUI lists the new session ID, the headline latency numbers, and the local trace path. Press Enter to dismiss and return to the dashboard. Switch back to F2 to drill into the just-created session and confirm Studio received the artifacts; from there the Studio web UI is the canonical place for charts, comparisons, and the trace viewer.