Validation from EdgeFirst Studio
A validation session is created from the Studio web UI; the session ID is then handed to the profiler on the target device, which downloads the model and dataset, runs the pipeline, computes the accuracy and timing metrics, and publishes the results back to Studio.
1. Create a validation session in Studio
Validation sessions need a writable project
Creating a validation session requires write access to the Studio project. You cannot validate against the read-only public Sample Project directly — first copy its dataset into a project you own (and add your model), then create the training and validation session there.
From the Model Experiments dashboard, open the training session whose artifact you want to validate, then click New Validation Session. Choose User Managed as the validation type.
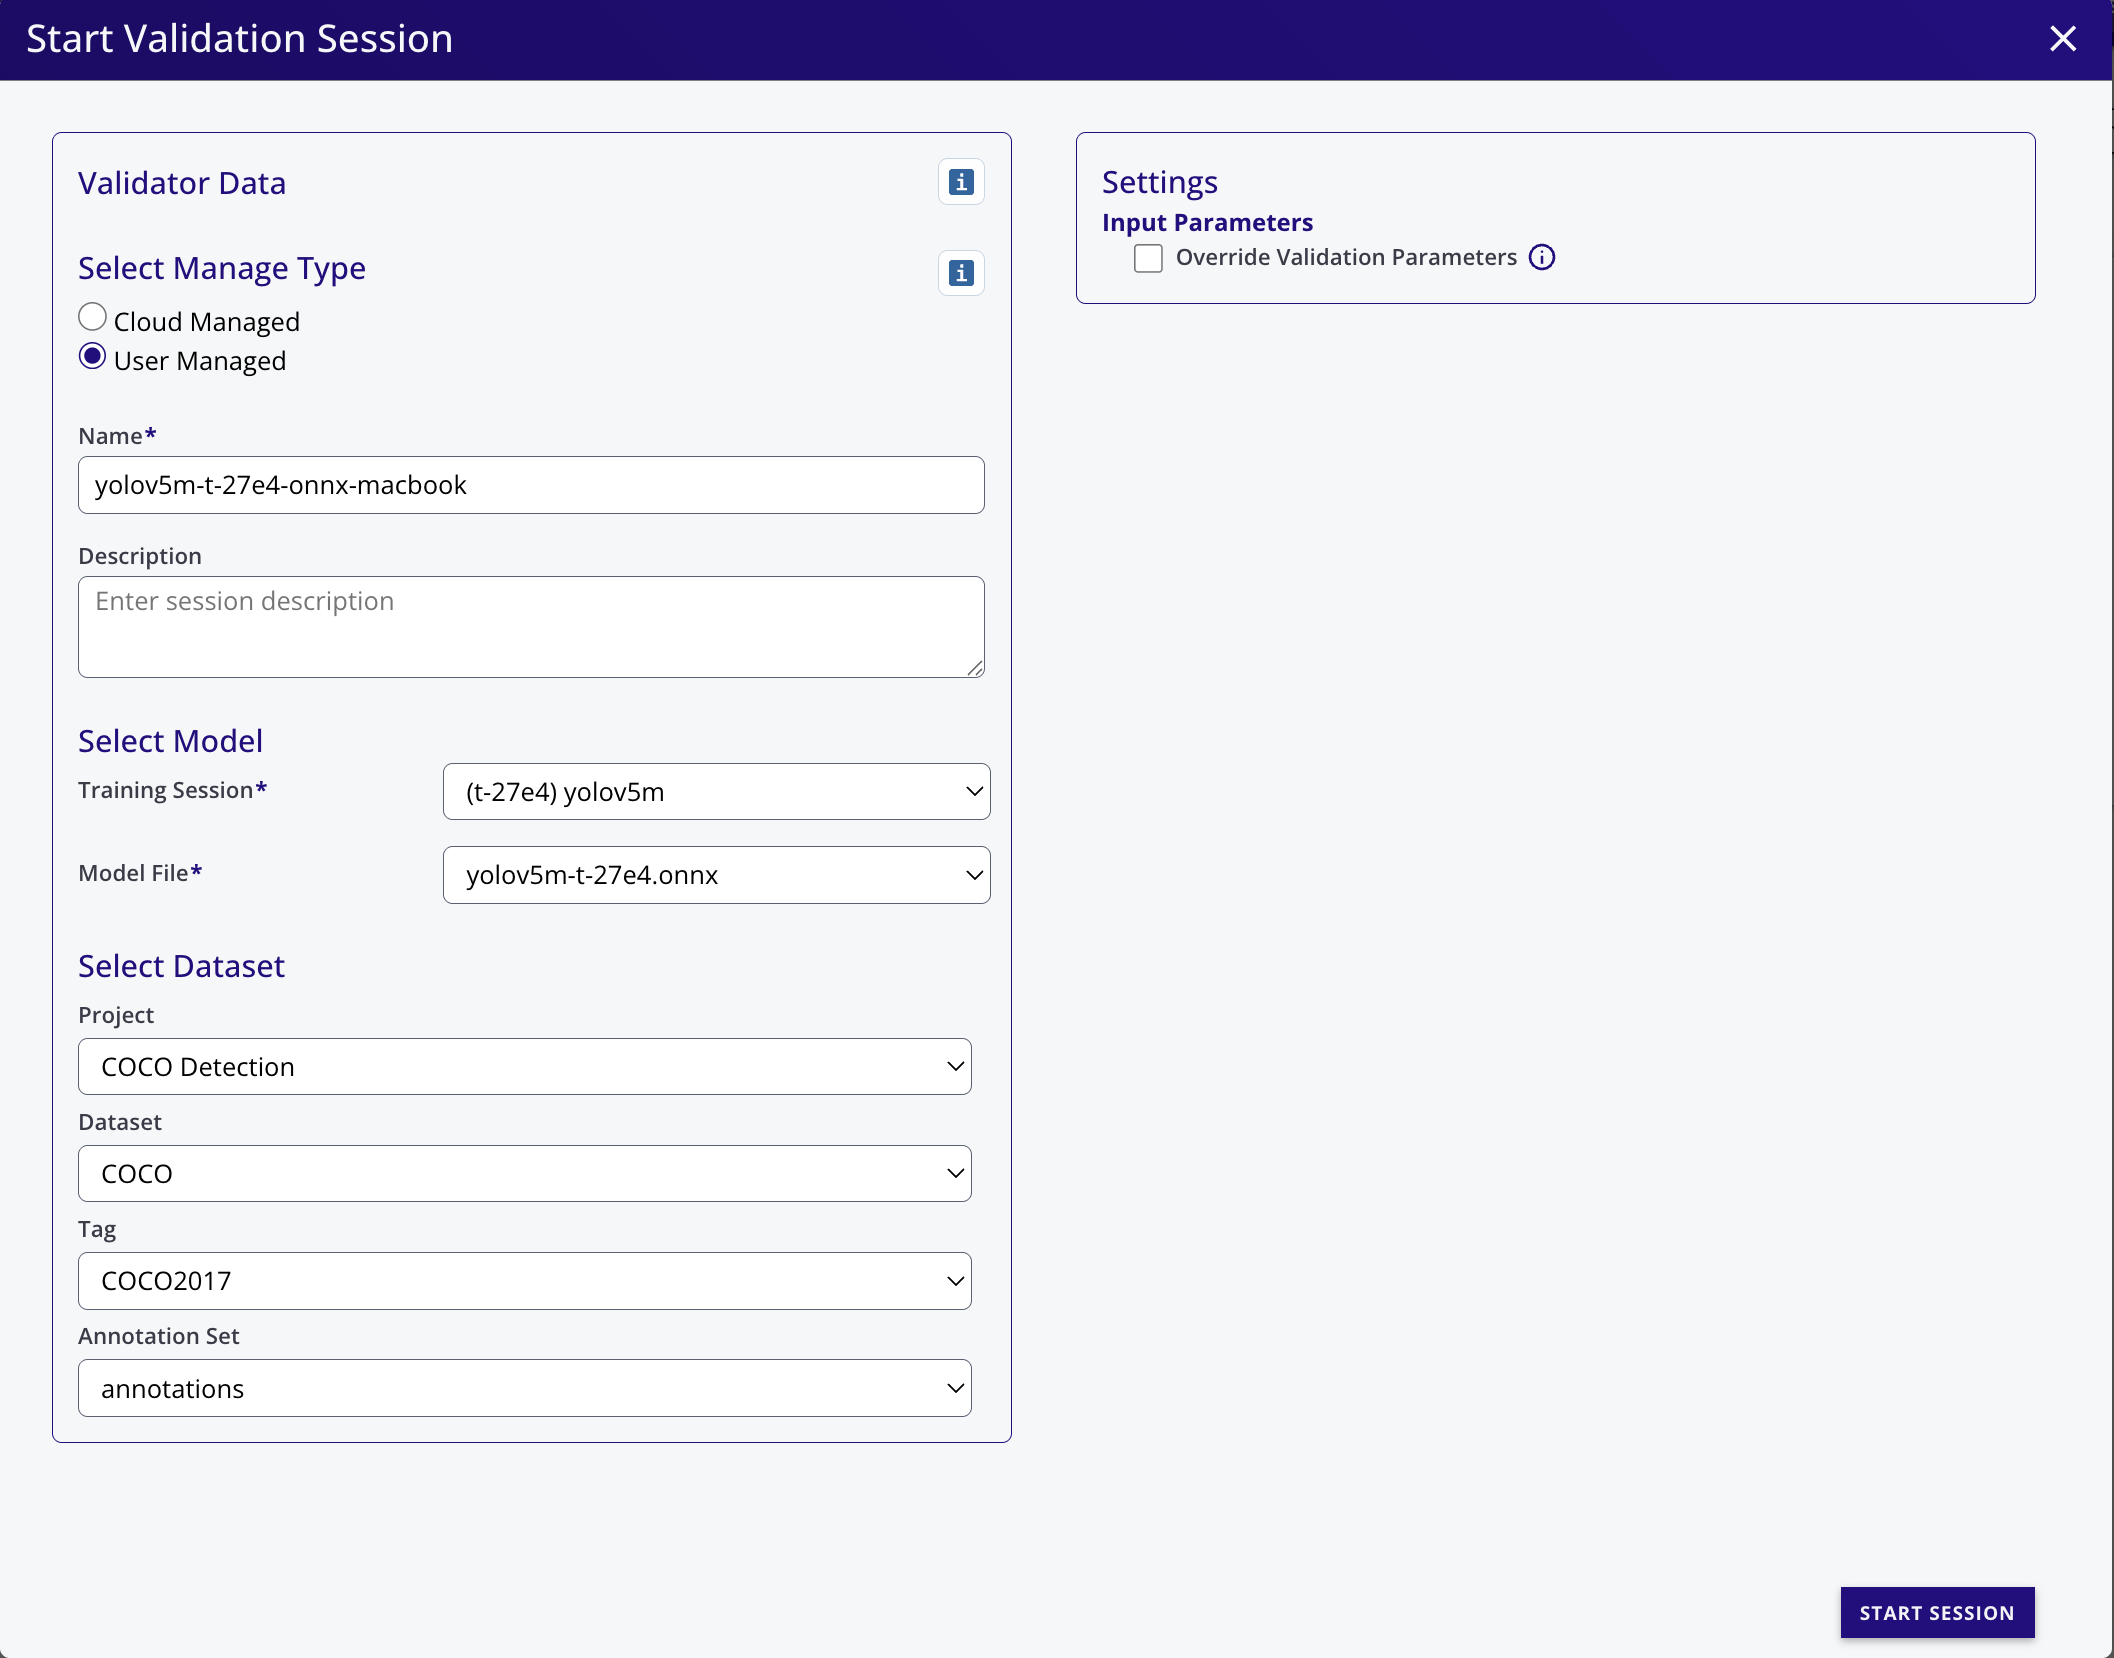
In the dialog, set:
- Session name — a human-readable label.
- Model artifact — the model file to validate (e.g.,
best.onnx,best.tflite,best.engine). The list reflects every artifact the training session produced. - Dataset / partition — the dataset and partition the profiler will validate against (typically
validation). - Parameters — confidence threshold, IoU threshold, NMS top-K, max detections. Defaults match the COCO evaluation protocol; override only if you know why.
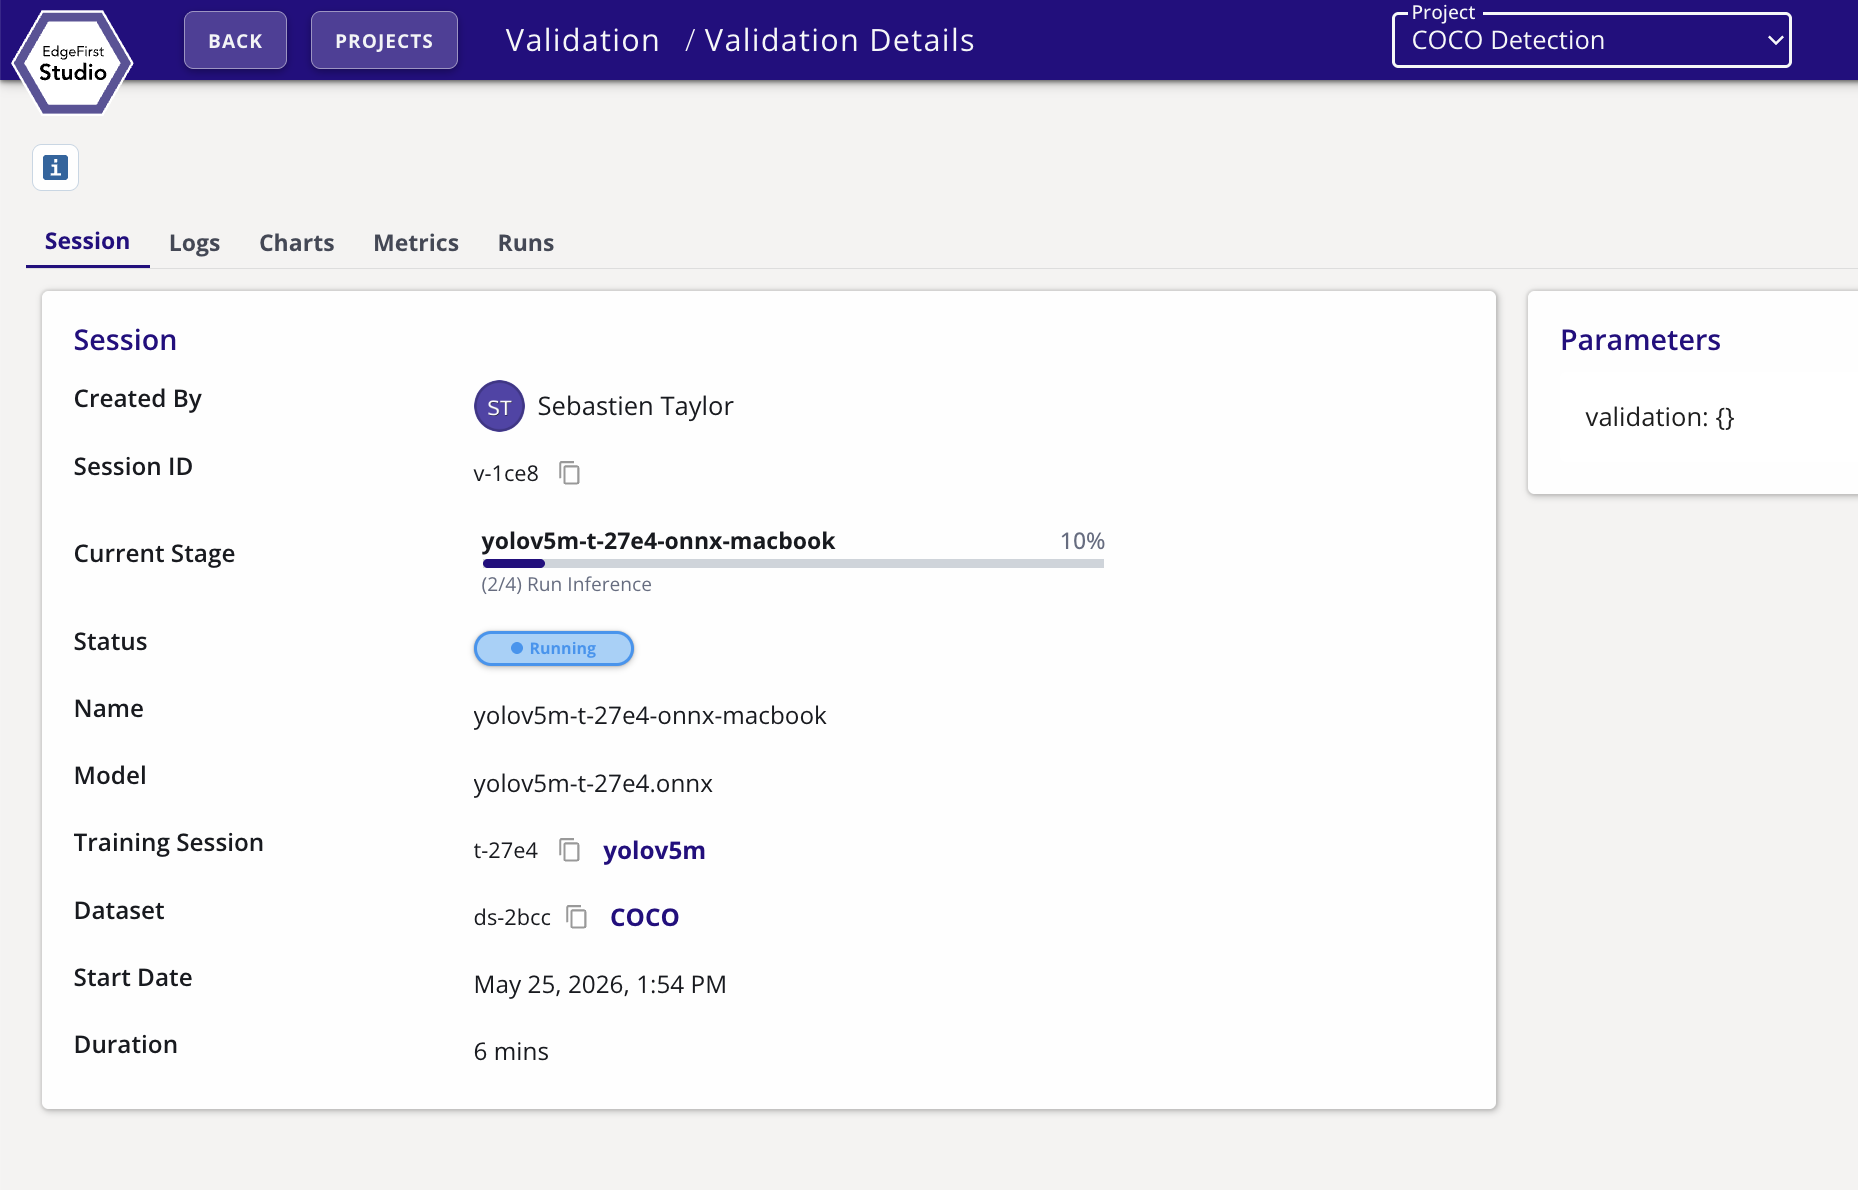
Click Start Session. Click the new validation session to open its details page. The session ID appears at the top of the Session tab (e.g., v-1b51).
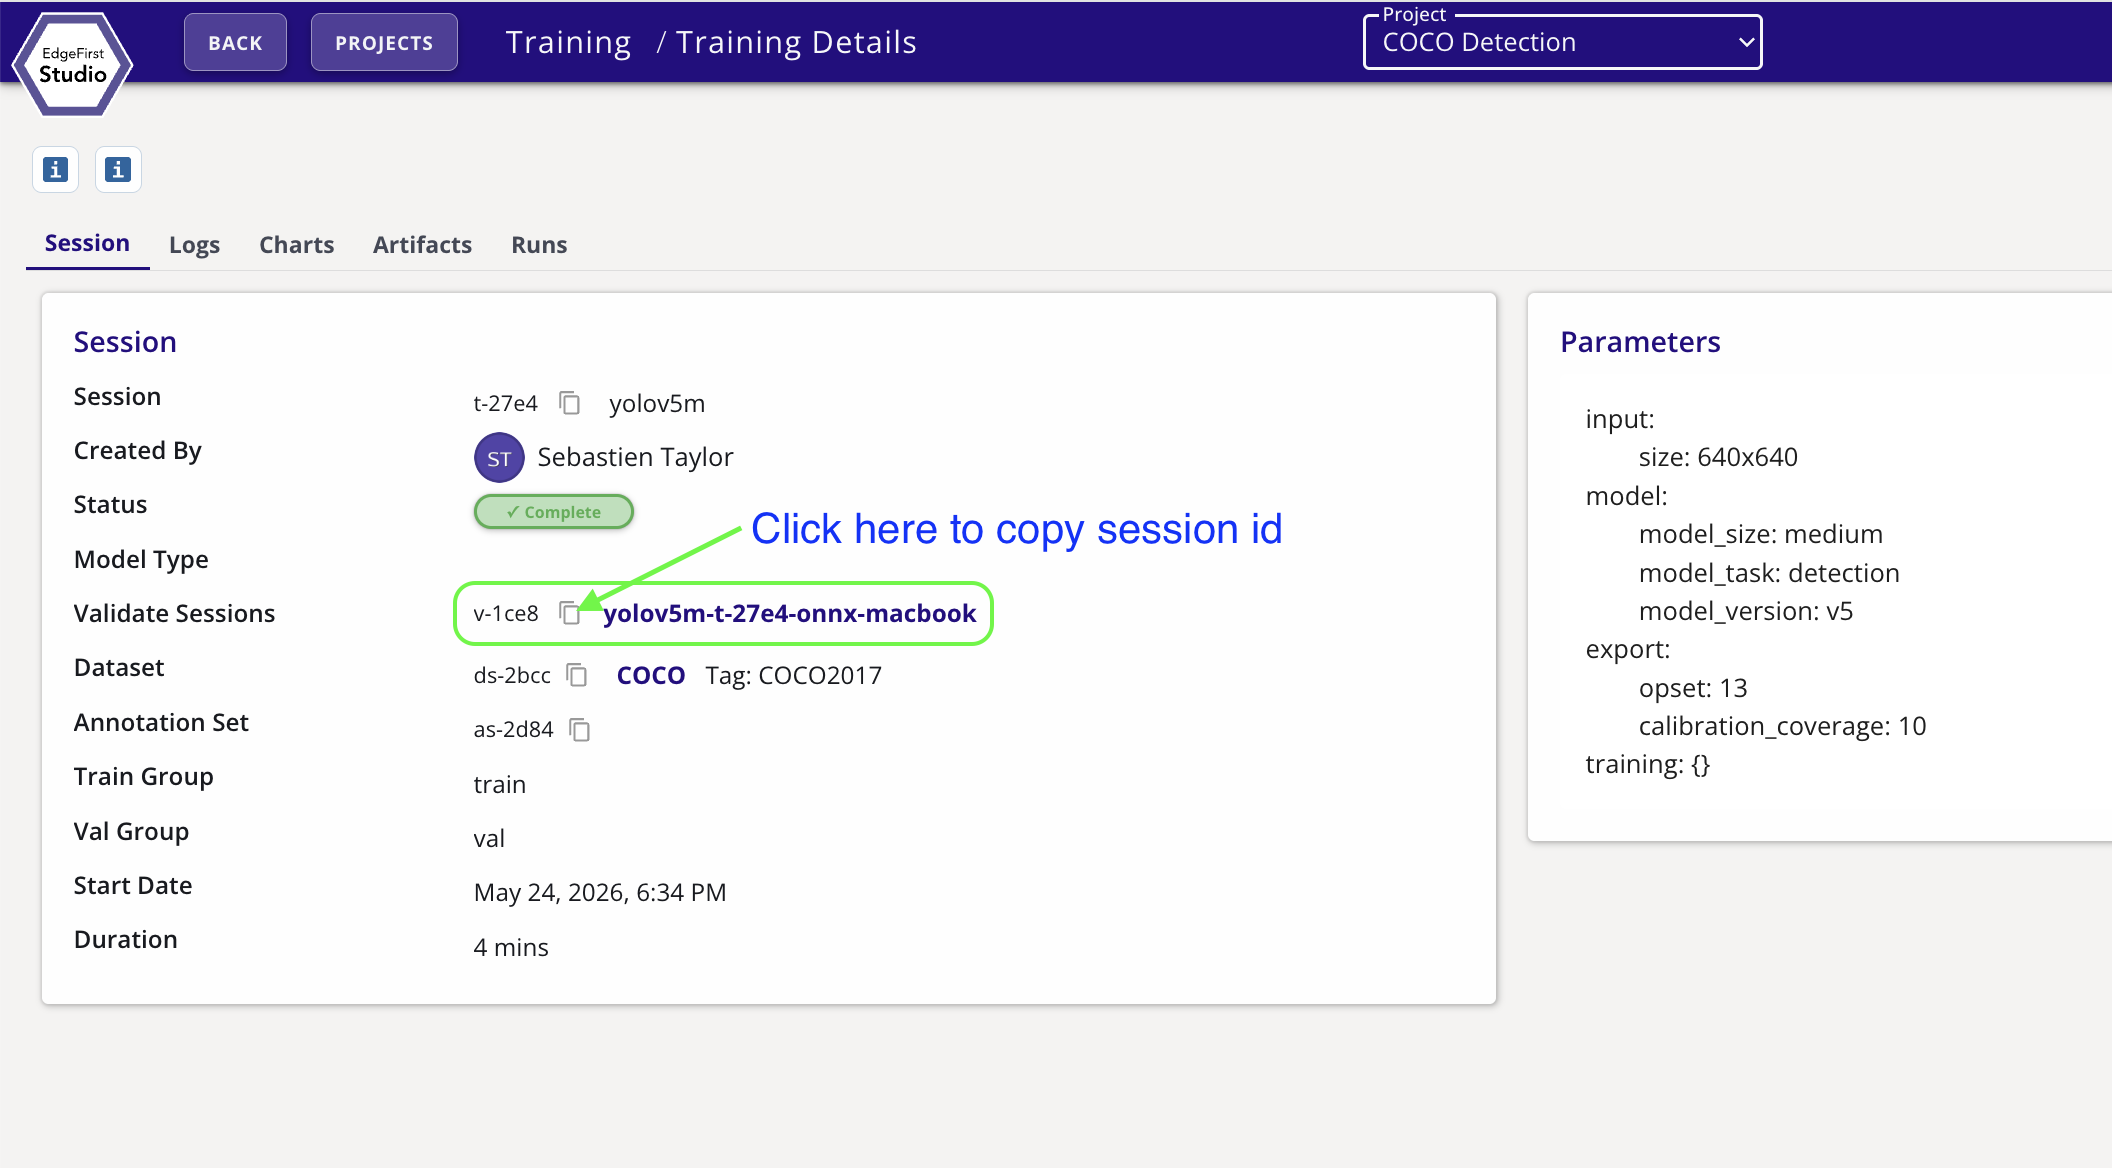
2. Run the profiler on the target
SSH into the target board and, if you have not already, install the profiler and sign in to Studio.
Run the validation pass:
edgefirst-profiler validate --session-id v-1b51
When invoked with --session-id directly from the terminal, the profiler runs headlessly — there is no TUI, just a progress-bar-driven report. The same workflow is also available from inside the TUI; see Validation from the Profiler for that path.
Re-running an existing session uses the flags you pass now
Naming an existing validation session runs it again with the flags given now — it does not restore the ones its previous run used. Pipeline options such as --sahi must be passed again, or the re-run profiles a different pipeline and replaces the earlier results with it. Every run report states whether tiled inference was used, so a replaced tiled run is at least visible after the fact.
The profiler:
- Resolves the session against Studio.
- Downloads the model artifact and dataset partition into the cache (
~/.cache/edgefirst-profiler/on Linux,~/Library/Caches/edgefirst-profiler/on macOS). - Runs the full pipeline (Image Load → Pre-processing → Inference → Model Decoder → Materialize Masks → Logger) over every image in the dataset. In the timing tables these stages are labeled
capture,preprocess,inference,model_decode, andmaterialize_masks; the Logger stage records results and is not timed as a pipeline stage. Materialize Masks only does work for segmentation models. - Writes
predictions.parquetandtrace.pftrace, then computes the COCO accuracy metrics on the device itself — see Validation and Metrics. - Publishes the full artifact set to the session: predictions, trace,
metrics.yaml,platform.yaml, and the chart JSONs.
Pass --no-publish to keep the run local, or --validation off to publish the predictions and trace without computing accuracy metrics (useful when you just want the trace).
Two profiler runs can share one dataset cache
A second run that finds another profiler still downloading the same dataset — two containers mounting one cache volume, for example — waits for that download to finish and reuses it, instead of judging the half-finished copy incomplete and deleting it underneath the first run.
A validation session defines its own model, so --model cannot be combined with --session-id — the artifact is downloaded from the session (and reused from the cache on later runs).
What the run looks like
The output is a sequence of progress bars (model download, inference, prediction upload) followed by a formatted Session Report table — pipeline-stage timings, throughput, coverage, and a trace file path:
$ edgefirst-profiler validate --session-id v-1ce9
Fetching validation session v-1ce9...
[00:00:04 ETA: 0s] Downloading model ✓ ████████ 10.87 MB/10.87 MB
...
[00:02:48 ETA: 0s] Inference ████████ 5,000/5,000 (29.6/s)
...
  Pipeline Stage Breakdown
  -----------------------------------------------------------------------
  Stage                Mean   Median      p95      p99      Min      Max
  capture             2.7ms    2.6ms    4.2ms    6.0ms    477µs   22.2ms
  preprocess          1.1ms    766µs    2.7ms    8.8ms     89µs   29.2ms
  inference          33.4ms   31.8ms   40.6ms   47.1ms   28.4ms    1.35s
  model_decode        1.2ms    1.1ms    2.1ms    3.0ms    412µs    8.4ms
  -----------------------------------------------------------------------
  End-to-end         39.1ms   37.2ms   48.0ms   55.7ms   32.2ms    1.35s
  Throughput      29.6 FPS (min 21.4 / max 33.0 / p95 31.8 / p99 32.6)
...
Results published to Studio session v-1ce9
View details: https://edgefirst.studio/...
The Pipeline Stage Breakdown shows the same data that drives the F4 TUI dashboard, formatted as a static table. The transcript above is abbreviated (... lines) — the full report also prints the local path of the trace file; the same file is uploaded to Studio, where the full-resolution trace viewer lives in the validation session card. Warnings — corrupt images, decoder errors, skipped frames — print to the console by default; raise the verbosity with -v, -vv, or -vvv for info, debug, or trace detail.
System resource samples need a supported platform
The System Resources rows are sampled from /proc, /sys, and hwmon on Linux, including board power on devices with a supported power sensor. Apple Silicon Macs report CPU, GPU, ANE, and DRAM power. On other hosts, unsupported gauges are reported as unavailable.
3. Watch the session in Studio
While the profiler runs, the session card in Studio updates with status and progress. When the profiler finishes computing and publishing the metrics, the card transitions to Complete and the View Validation Charts button appears.
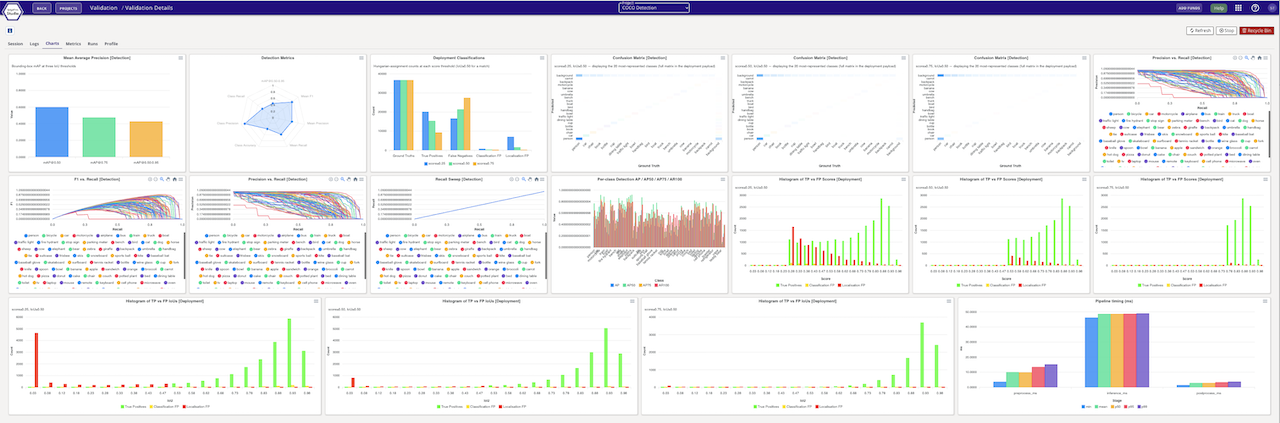
The metrics dashboard contains COCO-equivalent metrics computed by the profiler's own evaluator (box mAP@0.5:0.95, AP/AR breakdowns, AP per class) plus instance-segmentation mask metrics when applicable. See Object Detection Metrics and Segmentation Metrics for the full reference.
4. Open the trace in Studio
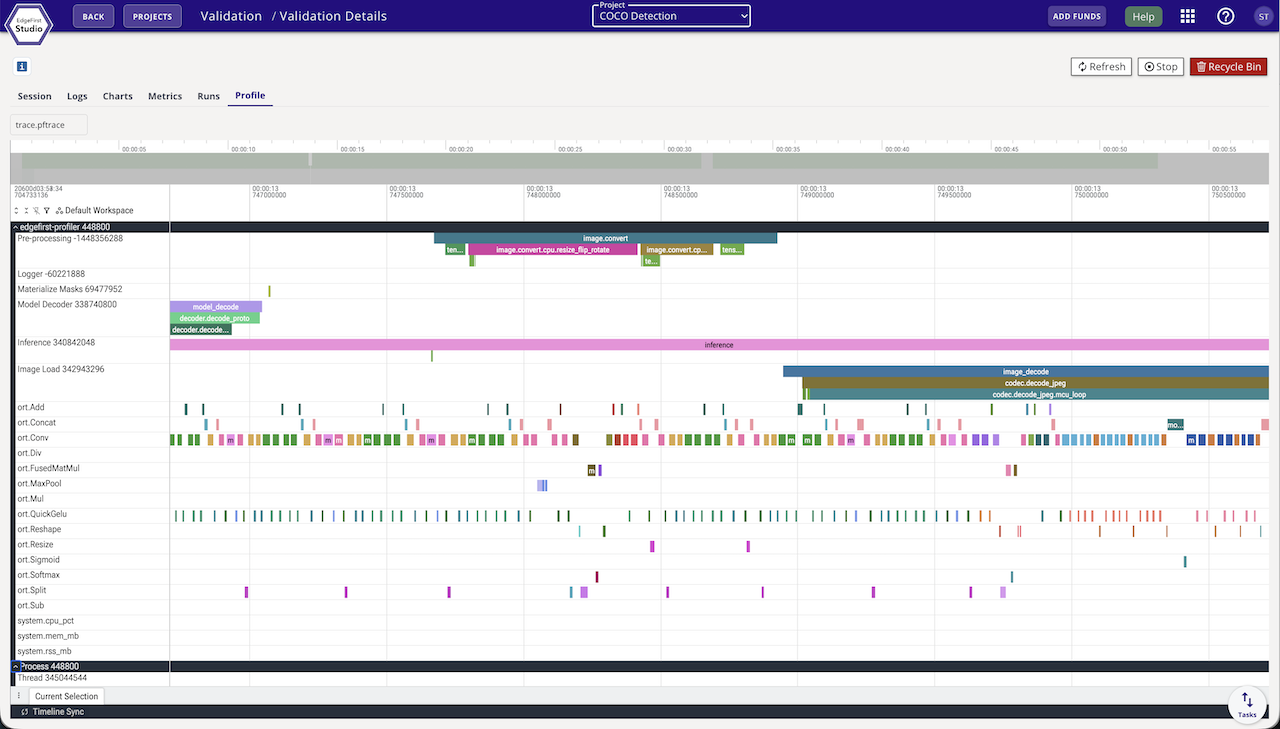
Click Open Trace on the session card to load the published trace.pftrace in Studio's trace viewer. The trace contains:
- Pipeline-stage spans (capture / preprocess / inference / model decode / mask materialization).
- Per-operator timing for the backend used (ORT nodes, TFLite ops, Neutron ticks, TensorRT layers, Hailo contexts).
- System-metric counters (CPU%, RSS, temperatures, and board power where a sensor is present).
Tips
- Override the output directory with
--output /path/to/resultswhen running on a board with a small root filesystem. - Choose when accuracy is computed with
--validation off|after|during.after(the default when ground truth is available) scores the run once profiling completes, keeping the evaluation off the measured hot path;duringevaluates concurrently while the pipeline runs, so the validation overhead itself is captured in the trace;offskips accuracy entirely and still publishes the predictions and trace — useful when iterating on a model where you have already confirmed accuracy. - Re-score without re-running the model.
--predictions <parquet>re-validates an existing predictions file against ground truth; add--trace <pftrace>to recover the run's measured timing, worker concurrency, and system telemetry fully offline.--session-id <id> --reprocessinstead fetches the session's own uploaded predictions from Studio and re-scores them, for machines that never held the original file. - Measure clean per-stage latency with
--serialize-core, which runs every core pipeline stage one frame at a time (no overlap) for contention-free per-frame numbers to compare against the overlapped, throughput-oriented default. - Profile your own images with
--images <dir>, which overrides the session's dataset. Validation is disabled for such a run — the images carry no ground truth — and the profiler says so. - Pre-fill the TUI from a session by running
edgefirst-profiler --session-id v-1b51(novalidatesubcommand). The TUI launches and jumps straight to the F4 Profiler screen with the session already resolved.
Comparing runs
Two completed sessions can be opened side-by-side from the Model Experiments dashboard. See Validation Sessions for the comparison view.