Quick Start
This guide walks you from "nothing installed" to a published validation session in roughly fifteen minutes. The profiler is always operated against an EdgeFirst Studio session.
1. If you haven't already, log in to EdgeFirst Studio
- Go to EdgeFirst Studio
- If you do not have an account, create a free account on the landing page
- Log in with your username and password
2. Create your project in EdgeFirst Studio
-
From the User Home Page screen, click the "Projects" button.
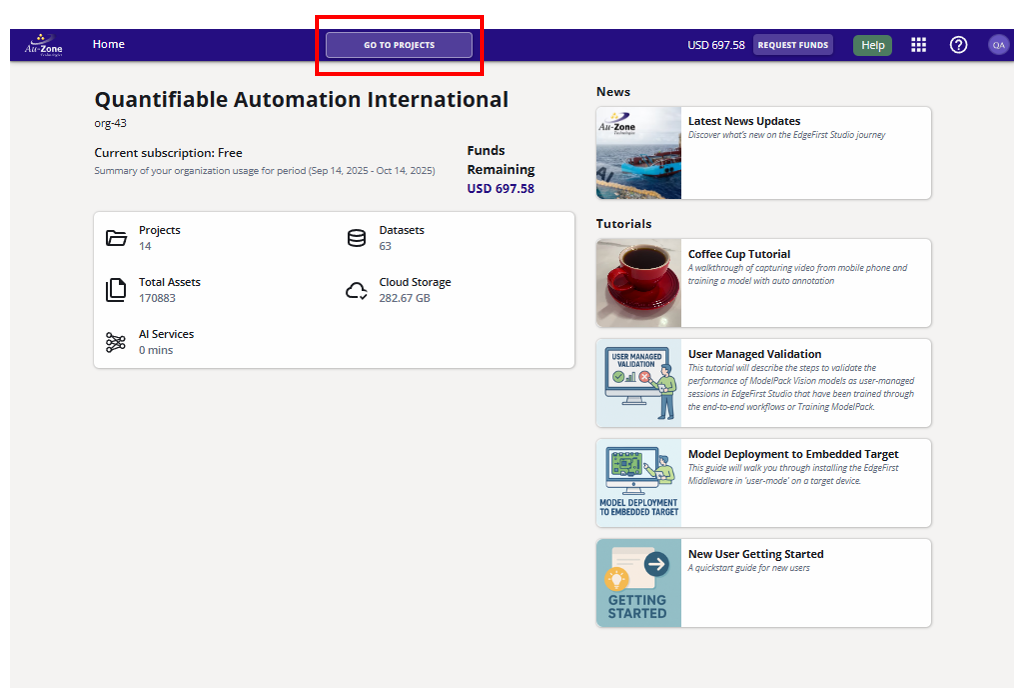
Go To Projects -
Now that you are in the "Projects" page, create your first project by clicking on the "New Project" button on the top-right corner of the page.
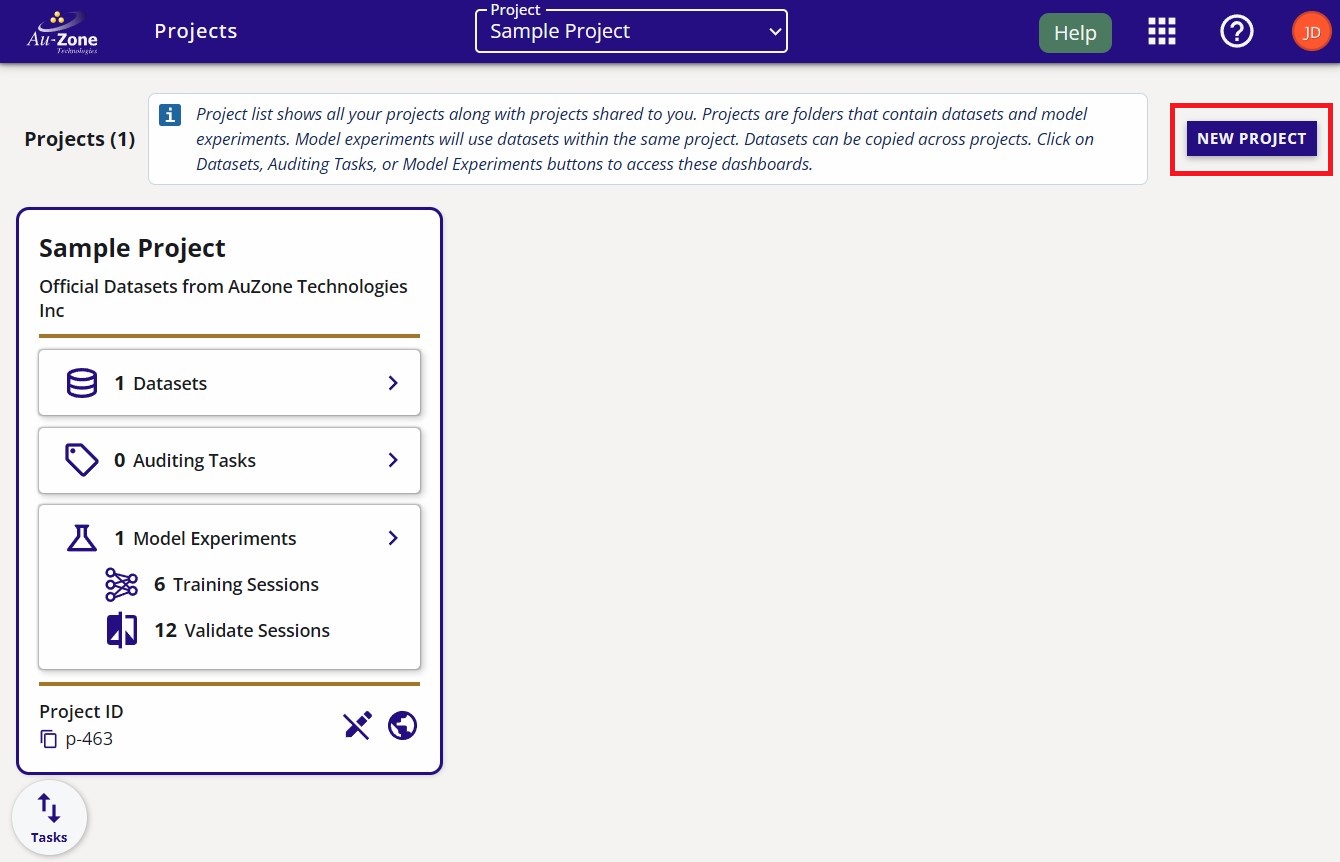
Create Project -
Provide a name and a description of the project as shown in the example below. Click the "Create" button to create your new project.
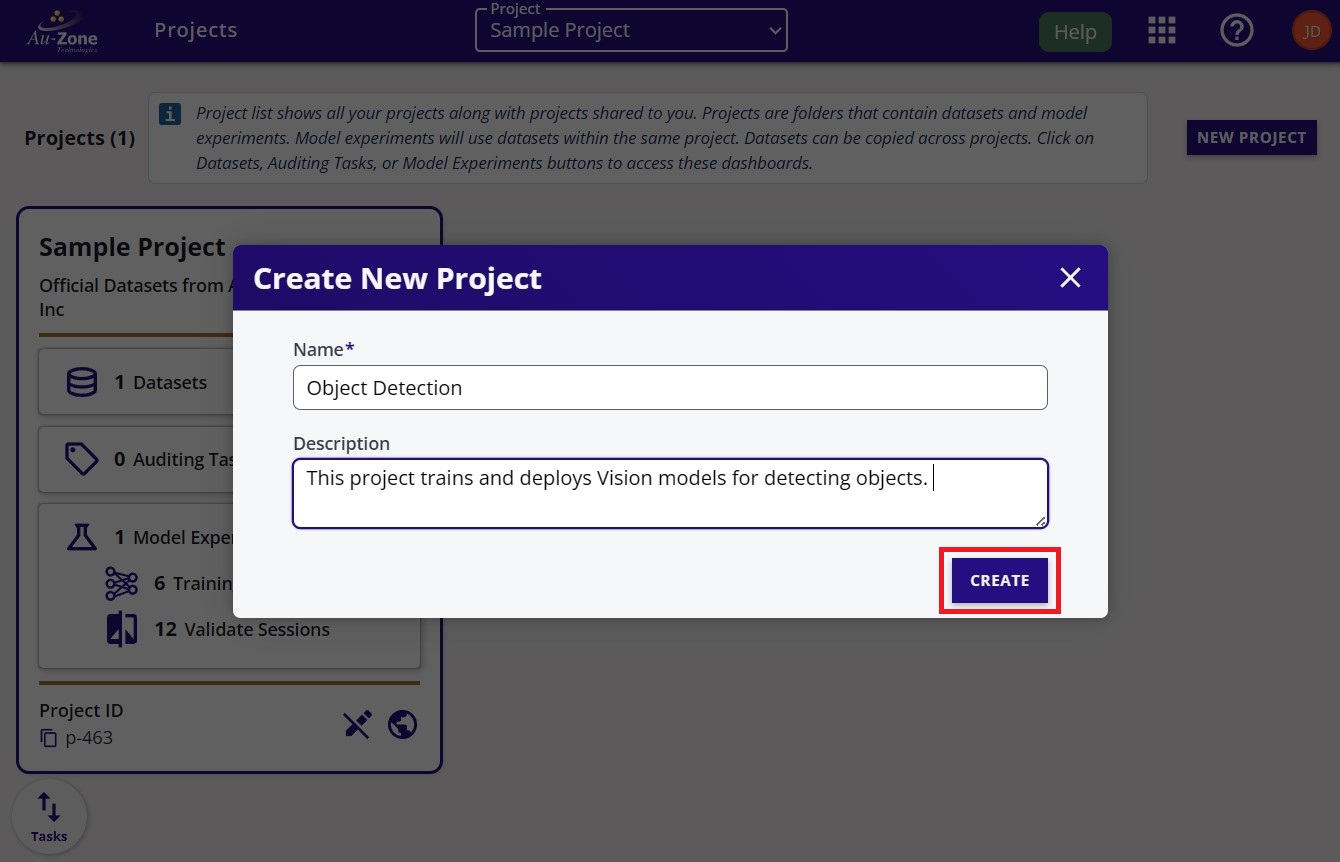
Project Details -
Your created project will be shown like the example below.
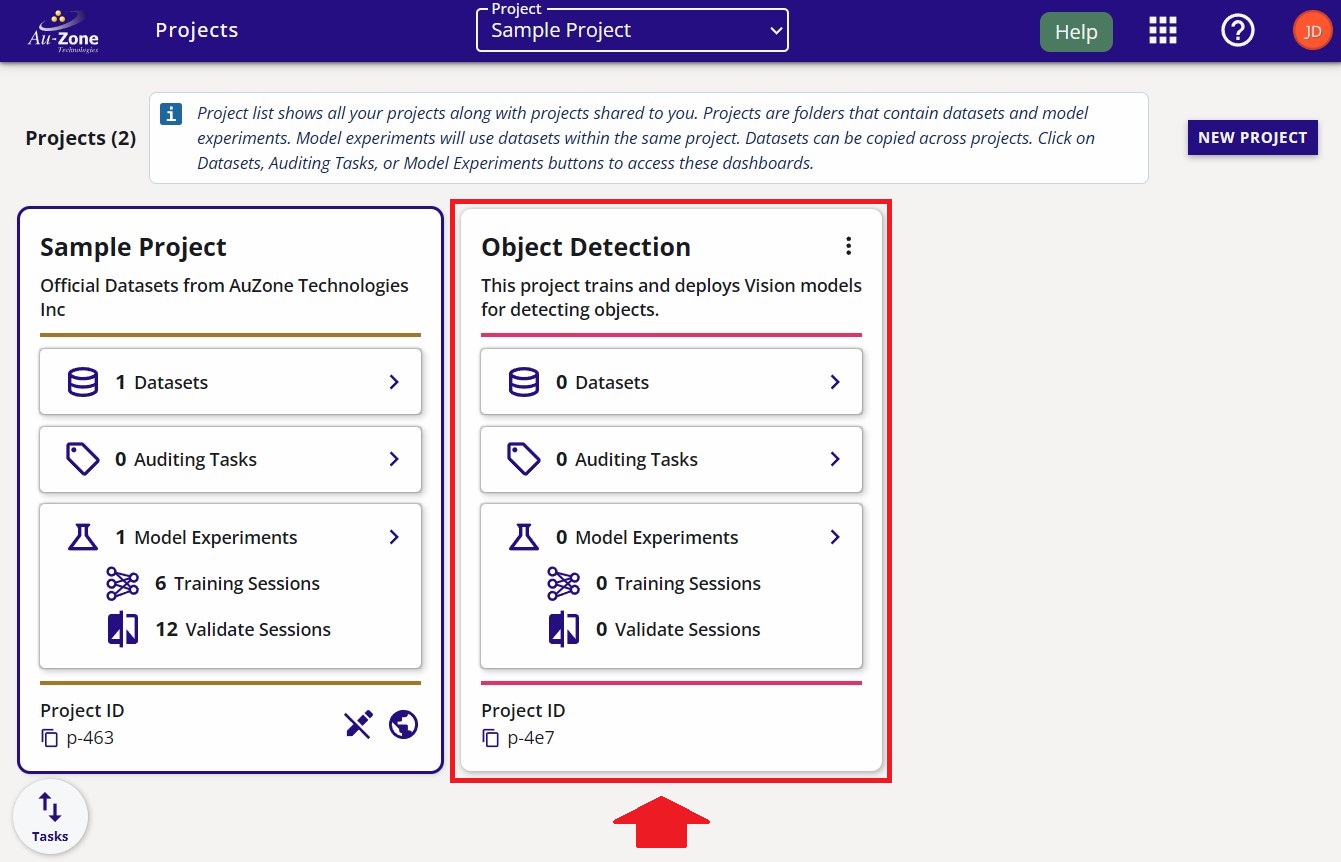
New Project
3. Create an Ultralytics training session
Use your own project
Profiling must be run against a project you own. Running a profiling or validation session on the Sample Project — or any public, read-only project — will fail with an error. Make sure you created your own project in Step 2 before continuing.
-
Click on "Model Experiments" of your created project
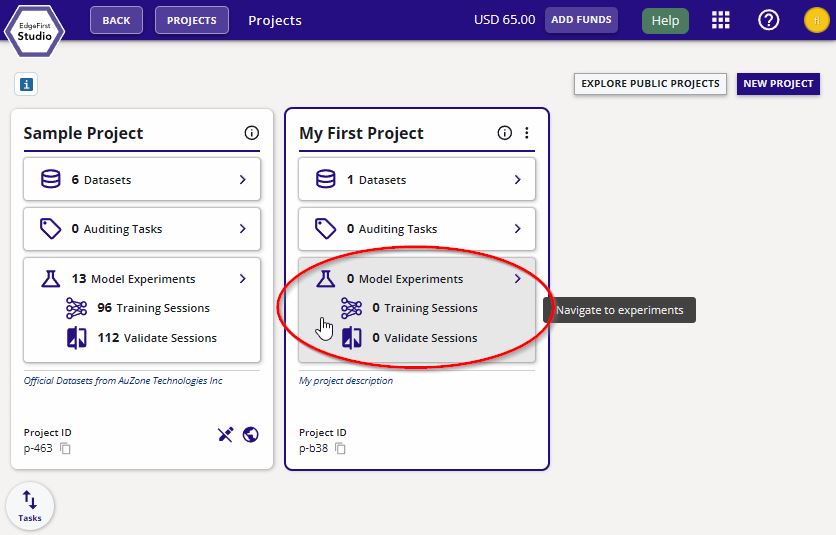
Model Experiments Page -
Create a new experiment
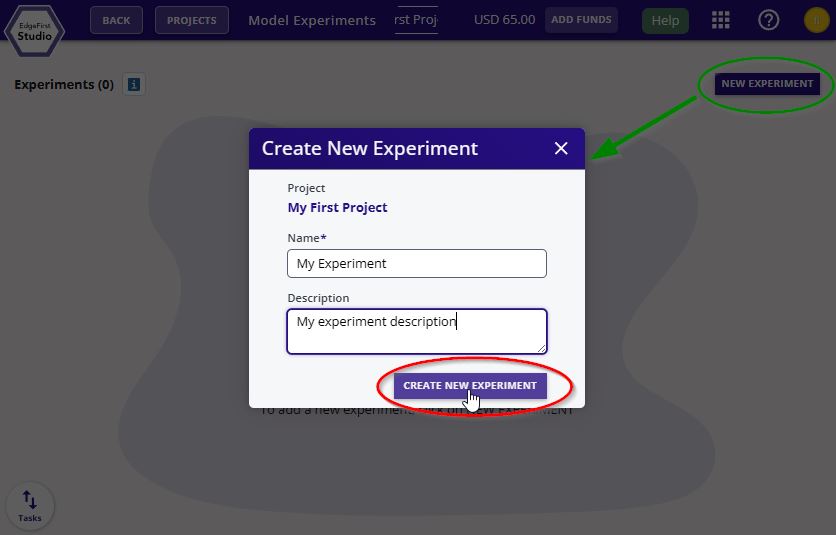
Model Experiments Page -
Navigate to the "Training Sessions"
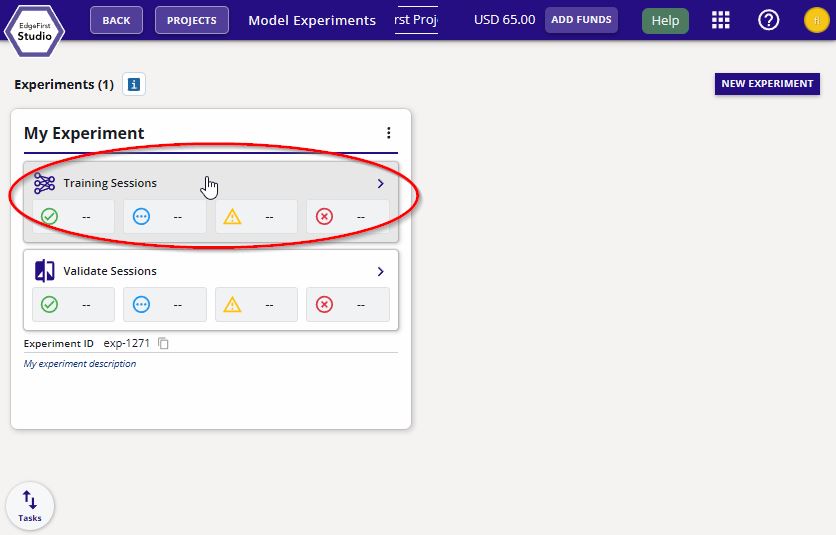
Training Sessions -
Create a new training session by clicking the "Actions" dropdown menu on the top right of the page and then click the "+ New" button
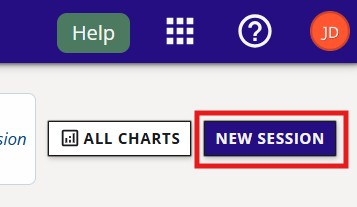
New Session Button -
Start a YOLOv8n detection model by following these settings. Once the settings are set, click on "Start Session" at the bottom of the window
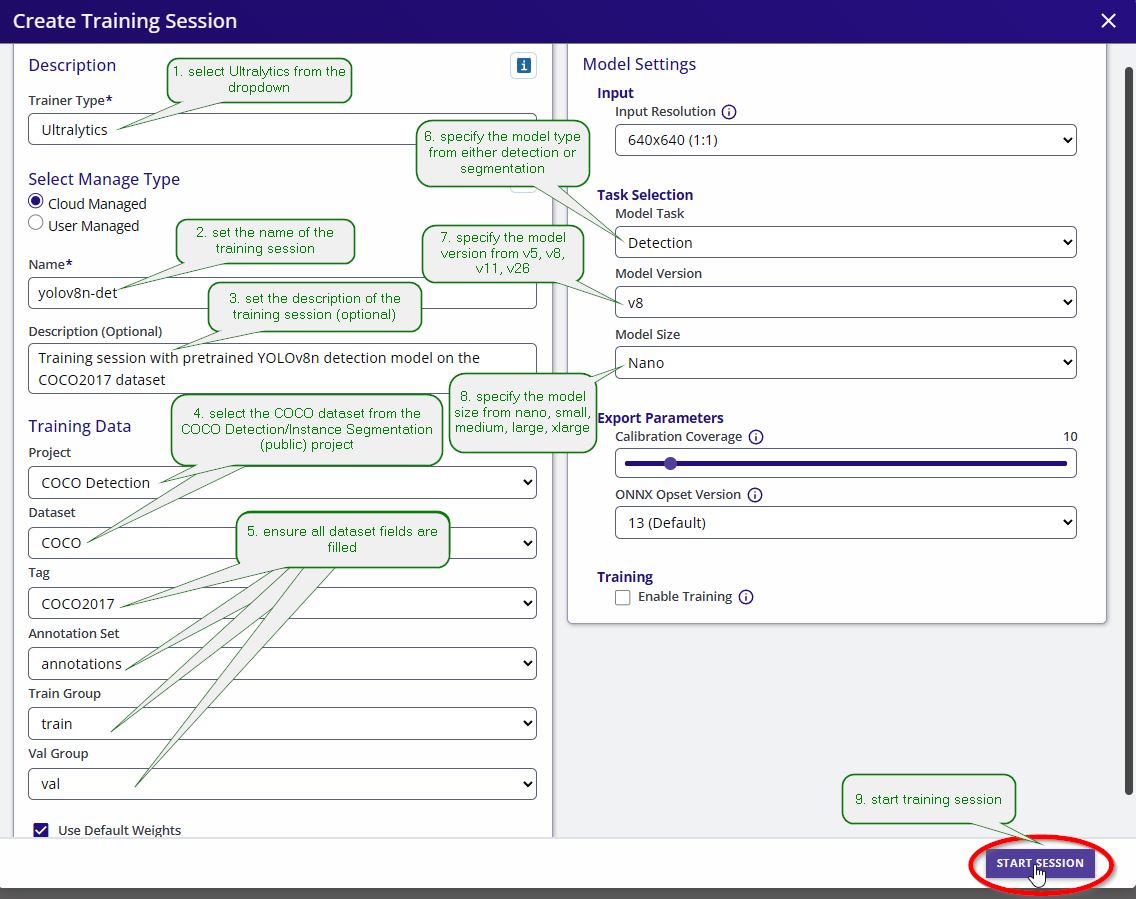
Ultralytics Training Settings This will start a training session in progress.
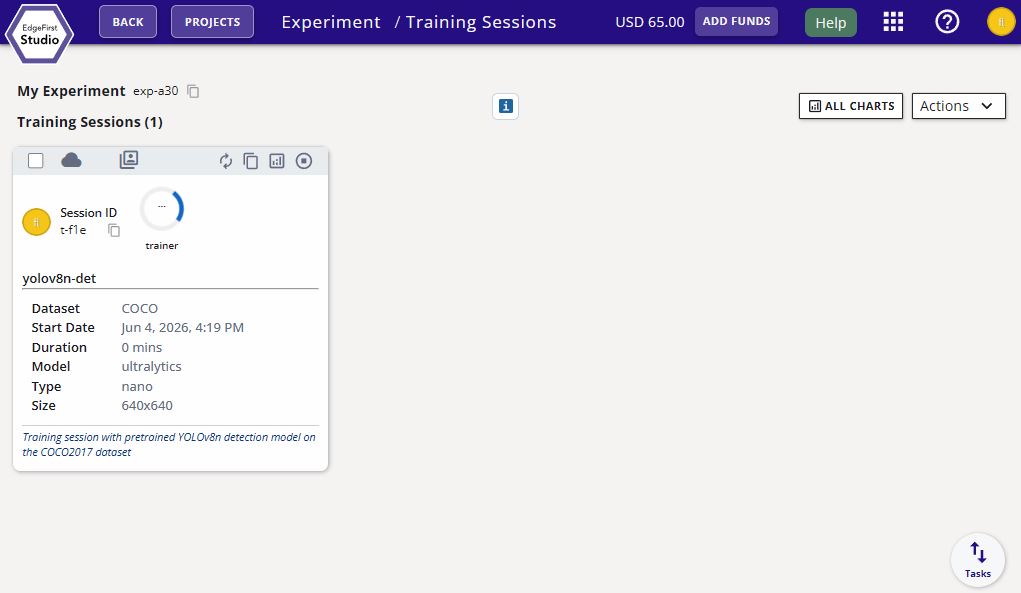
Ultralytics Training Progress InsufficientInstanceCapacity

If you see this error after starting your training session, retry creating the session. This can happen when AWS reports that no EC2 instances are currently available to launch; the current workaround is to retry.
No Training Charts
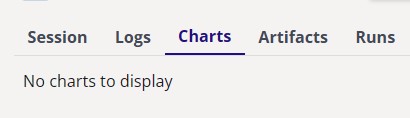
Training sessions configured without epochs will not generate loss or metric charts, since the chart x-axis is epoch-based. This is expected behavior.
-
The completed training session should look like the following
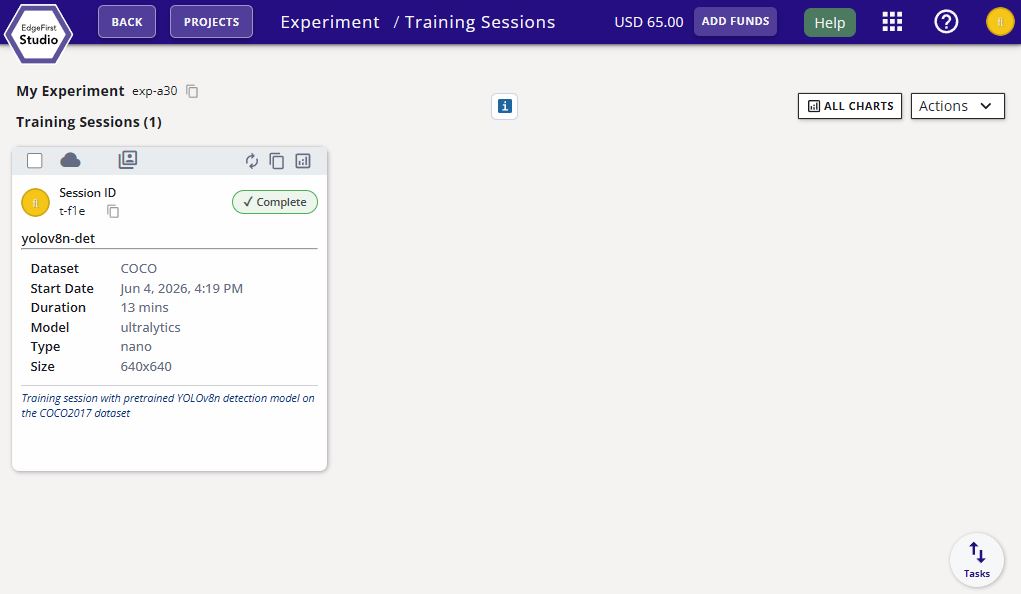
Ultralytics Training Completed -
We support model conversion and optimization workflows that enable trained models to be deployed on a wide range of target platforms and hardware architectures.
Follow the model conversion workflow that corresponds to your target platform. If you are deploying to a Windows/Linux PC or macOS system, you can skip this section and proceed directly to the next step to validate the ONNX model, which is automatically generated as part of the training session outputs.
If you are deploying to one of the supported hardware platforms listed below, follow the platform-specific conversion instructions for your target device.
Converter Supported Targets Output Format Docs TFLite Converter NXP i.MX 8M Plus (VIP8000), generic CPU/NPU TFLite delegates .tfliteflatbufferTFLite Converter Neutron Converter NXP i.MX 95, i.MX 943/952, S32N79, MCX N54x/N94x, i.MX RT700, S32K5 .tfliteflatbuffer with Neutron microcodeNeutron Converter TensorRT Converter NVIDIA Jetson (Orin Nano Super validated; broader lineup in progress) .tensorrt.zipbundle (engine built on-device)TensorRT Converter Ara2 Converter NXP Ara240 DNPU .dvmDataflow Virtual Machine binaryAra2 Converter Hailo Converter Hailo-8 (26 TOPS), Hailo-8L (13 TOPS) .hefHailo Executable FormatHailo Converter -
All converted models should appear under the model artifacts of the training session card. Click on the training session card to expand for more details.
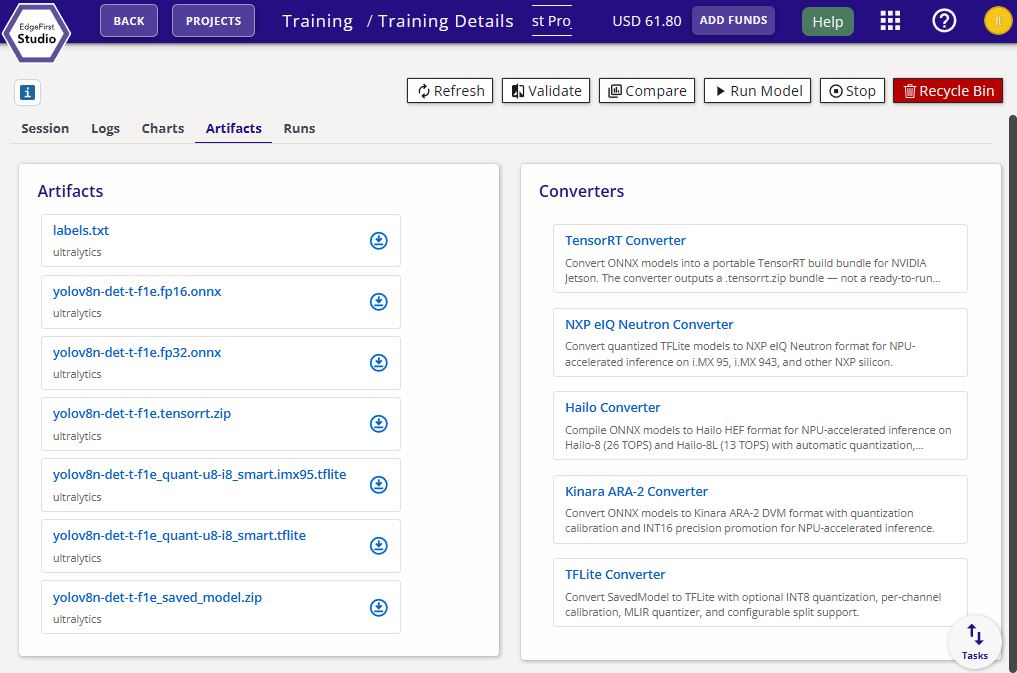
YOLOv8n Detection Model Artifacts Once you have converted your model, you can proceed towards profiling and validating the performance of your model next.
4. Install the profiler
The recommended convenience path is pip. The wheel ships the same native binary the platform installers deliver, and pulls in the few Python-side helpers needed for end-to-end workflows. Platform installers are provided for environments where Python is not available.
pip install edgefirst-profiler
curl -fsSL https://raw.githubusercontent.com/EdgeFirstAI/profiler-cli/main/install.sh | bash
docker pull ghcr.io/edgefirstai/profiler-cli:onnx
Confirm the install:
edgefirst-profiler --version
For per-target details (NPU delegates, runtime libraries, hardware-specific quirks) see the installation guides. On the NXP i.MX targets the container images are often the shortest path, because they bundle the vendor delegate and the TFLite runtime — see Container Images.
5. Sign in to EdgeFirst Studio (profiler CLI)
edgefirst-profiler login
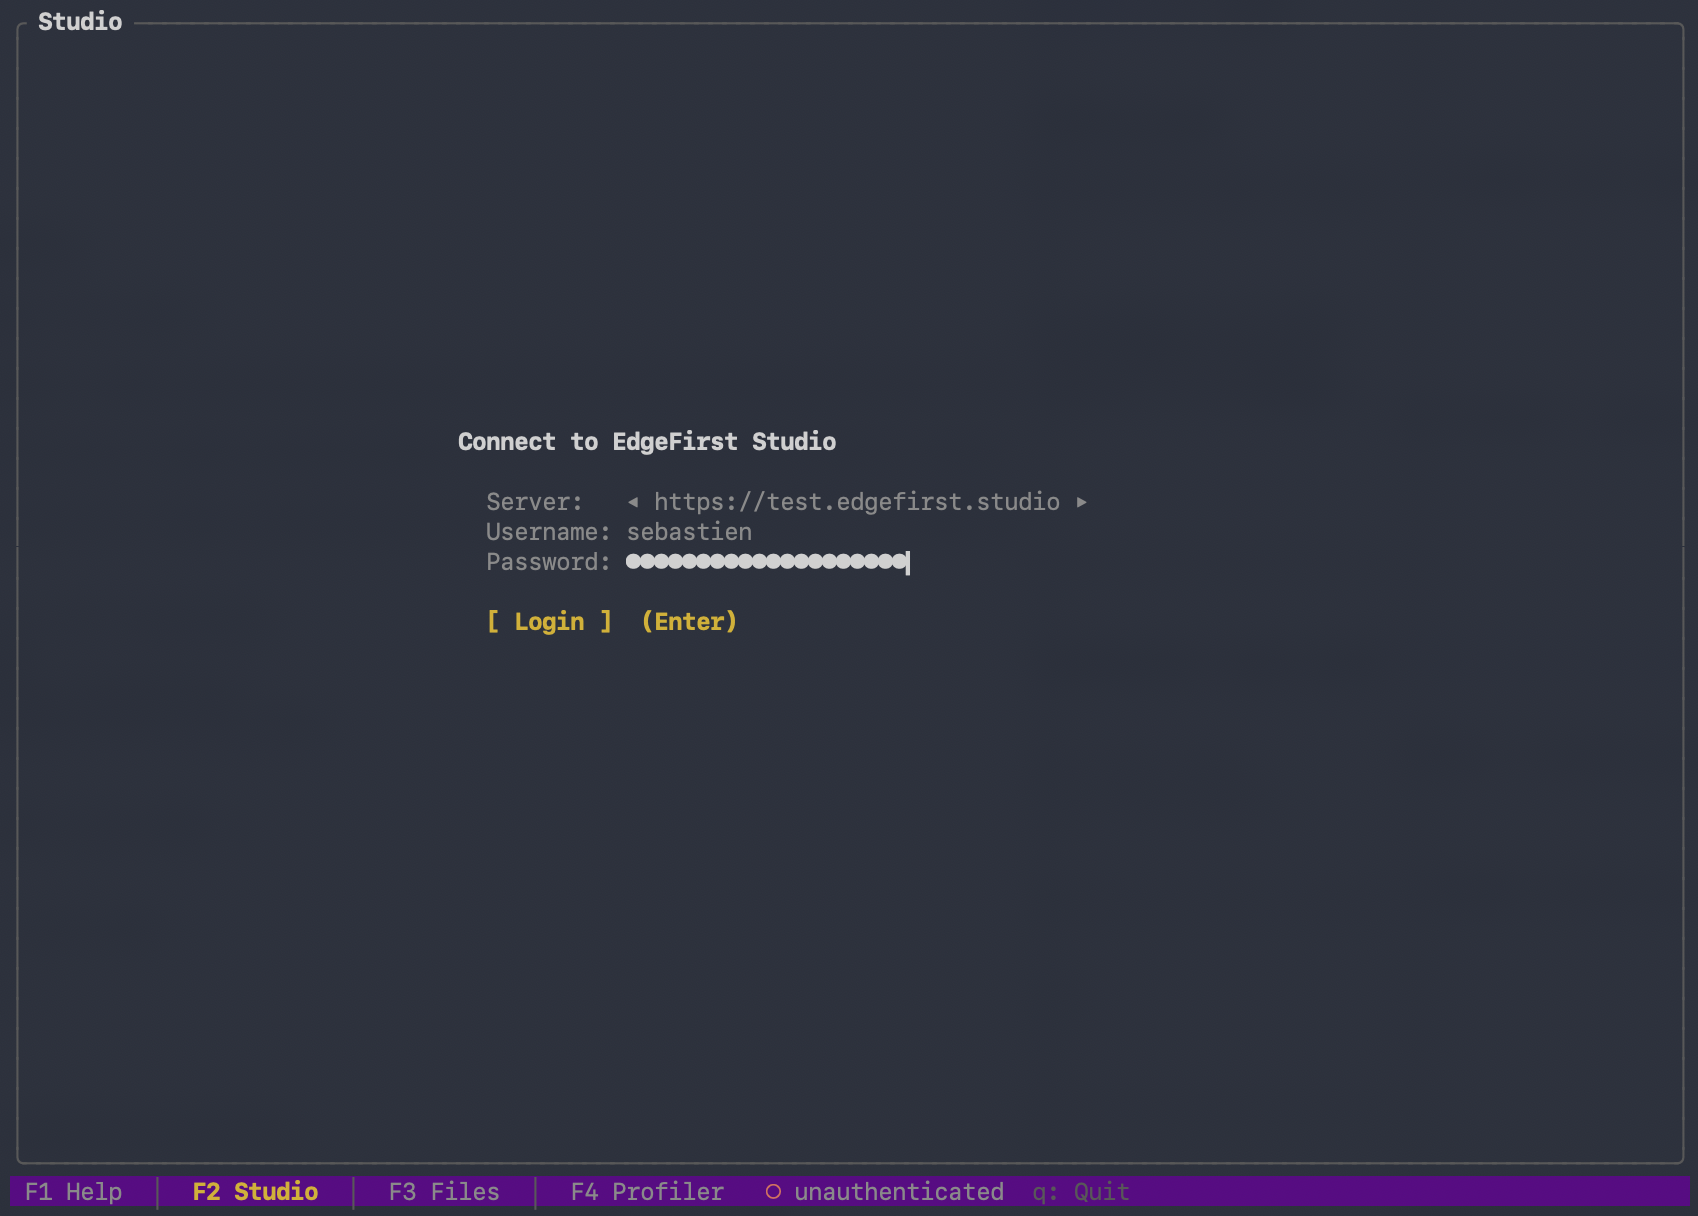
The interactive prompt asks for server, username, and password. The credentials are saved to ~/.config/edgefirststudio/token and refresh automatically while you are using the profiler. For headless / CI flows, see Connecting to EdgeFirst Studio.
6. Launch the TUI
Running edgefirst-profiler with no subcommand launches the interactive terminal UI. Any explicit subcommand — validate, login, report, publish, dispatch, system-info — bypasses the TUI and runs headlessly.
edgefirst-profiler
The TUI opens on the F1 Help screen, which lists the keybindings and the four screens available to you:
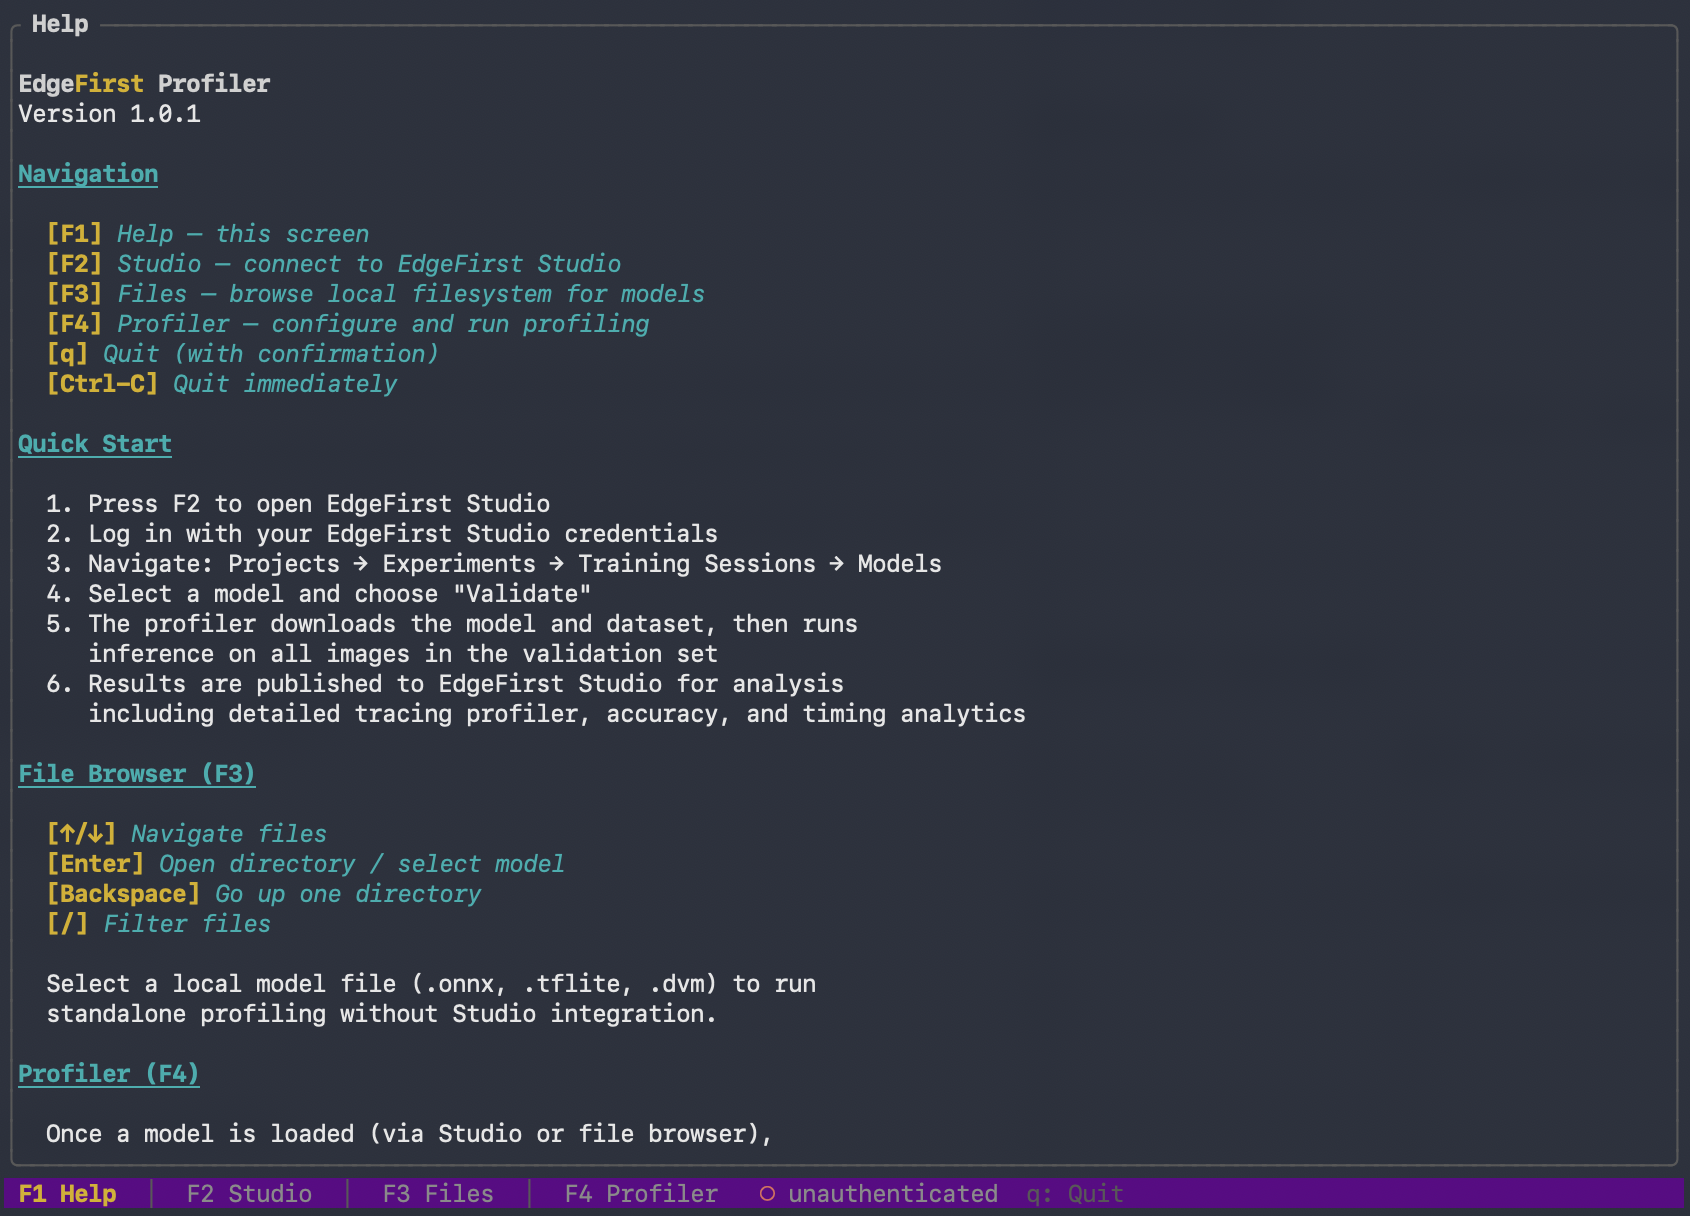
Four function keys switch between screens:
| Key | Screen | Purpose |
|---|---|---|
| F1 | Help | Keybindings and a short orientation — the landing screen |
| F2 | Studio | Sign in to EdgeFirst Studio, browse projects, run validation sessions |
| F3 | Files | Browse the local filesystem |
| F4 | Profiler | Configure and run a profiling pass with a live dashboard |
Press q to quit (disabled while typing into form fields). Ctrl-C always quits.
7. Run a validation session
The profiler is operated against a Studio validation session. Both paths produce the same Studio session card and the same set of accuracy charts.
Validation sessions need a writable project
Creating a validation session requires write access to the Studio project. You cannot validate against the read-only public Sample Project directly — first copy its dataset into a project you own (and add your model), then create the training and validation session there.
Path A — start from the profiler (recommended for new users)
Press F2 to switch to the Studio screen. If you are not signed in, the login form appears first.
Once signed in, navigate the explorer:
Projects → Experiments → Training Sessions → Artifacts
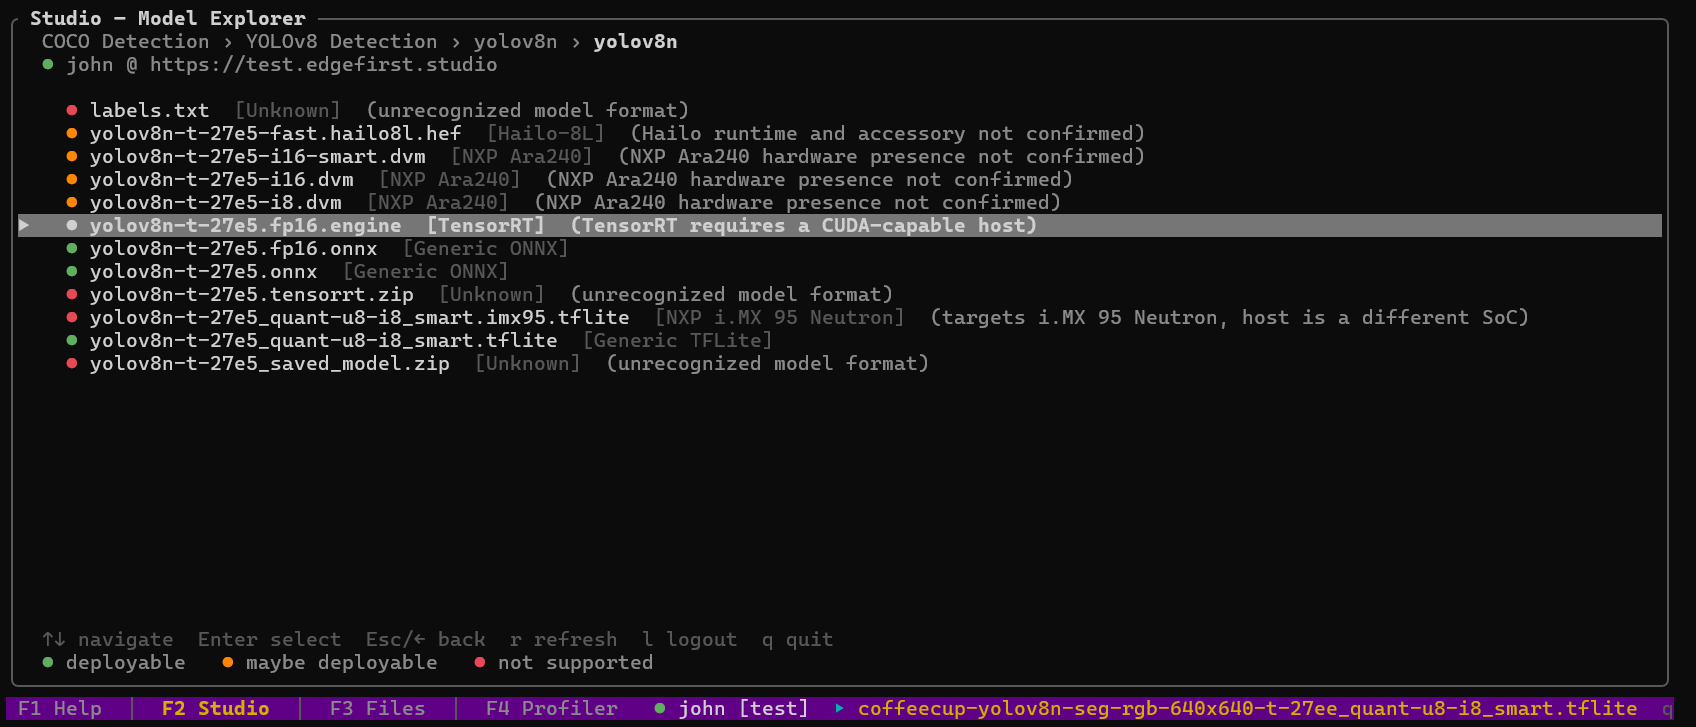
Each artifact is prefixed with a colored dot indicating whether it can be deployed on the current host:
| Indicator | Status | Meaning | Example artifacts |
|---|---|---|---|
| 🟢 Green | Deployable | Format recognized and all runtime requirements met on this host. | .onnx (Generic ONNX), .tflite (Generic TFLite) |
| 🟠 Orange | Conditions not confirmed | Known deployable format for a specific target, but the required hardware, runtime, or accelerator was not detected. | .hef (Hailo-8L runtime absent), .dvm (NXP Ara240 not present), .engine (no CUDA host), .imx95.tflite (different SoC) |
| 🔴 Red | Not deployable | Supporting file, archive, or unrecognized format — not a model the profiler can run directly. | labels.txt, _saved_model.zip, .tensorrt.zip |
Select an artifact and choose Validate. The profiler creates a new validation session in Studio, downloads anything missing, jumps to F4 Profiler, and starts the run.
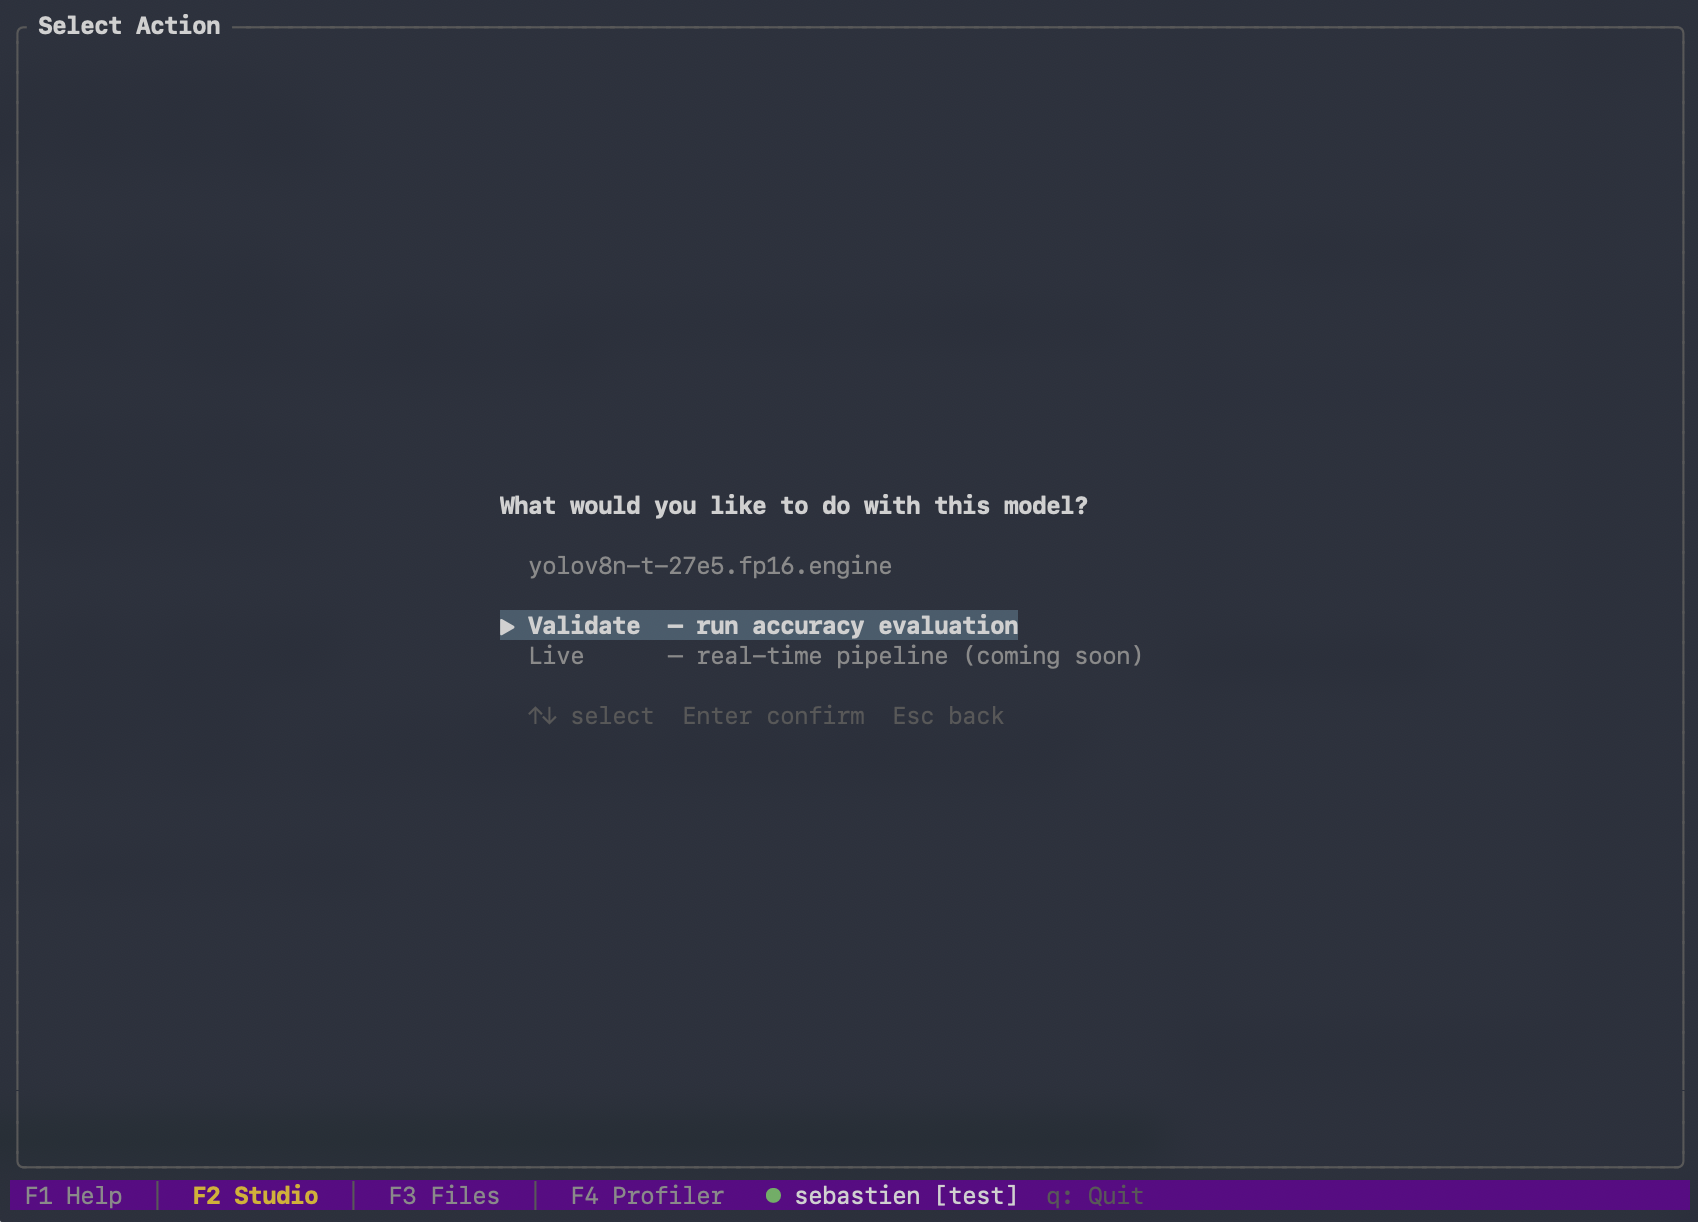
Before the run starts, a launch dialog appears. For ONNX models it first asks which execution provider to use — CPU, one of the three CoreML compute units on macOS, CUDA where an NVIDIA GPU is present, or the Qualcomm Hexagon HTP provider on Android. Then it shows five per-stage depth sliders — Capture, Preprocess, Inference, Postprocess, and Mask — each defaulting to Auto, which resolves to the value measured fastest for your model, runtime, and host.
Four keys start the run:
| Key | Effect |
|---|---|
Enter |
Launch immediately with Auto depths |
c |
Open the sliders and pin individual stages |
s |
Serialized-core preset — every core stage runs one frame at a time, for contention-free per-frame latency |
t |
Toggle SAHI tiled inference on or off (shown as Tiling: on/off) |
The dialog warns if a platform constraint (such as the i.MX 95 Neutron single-bind delegate) holds a stage to a single thread. See Pipelining for what each stage does and Tiled Inference (SAHI) for the tiling toggle.
The F4 dashboard streams iteration-level latency, system metrics, and per-stage timings while the run executes:
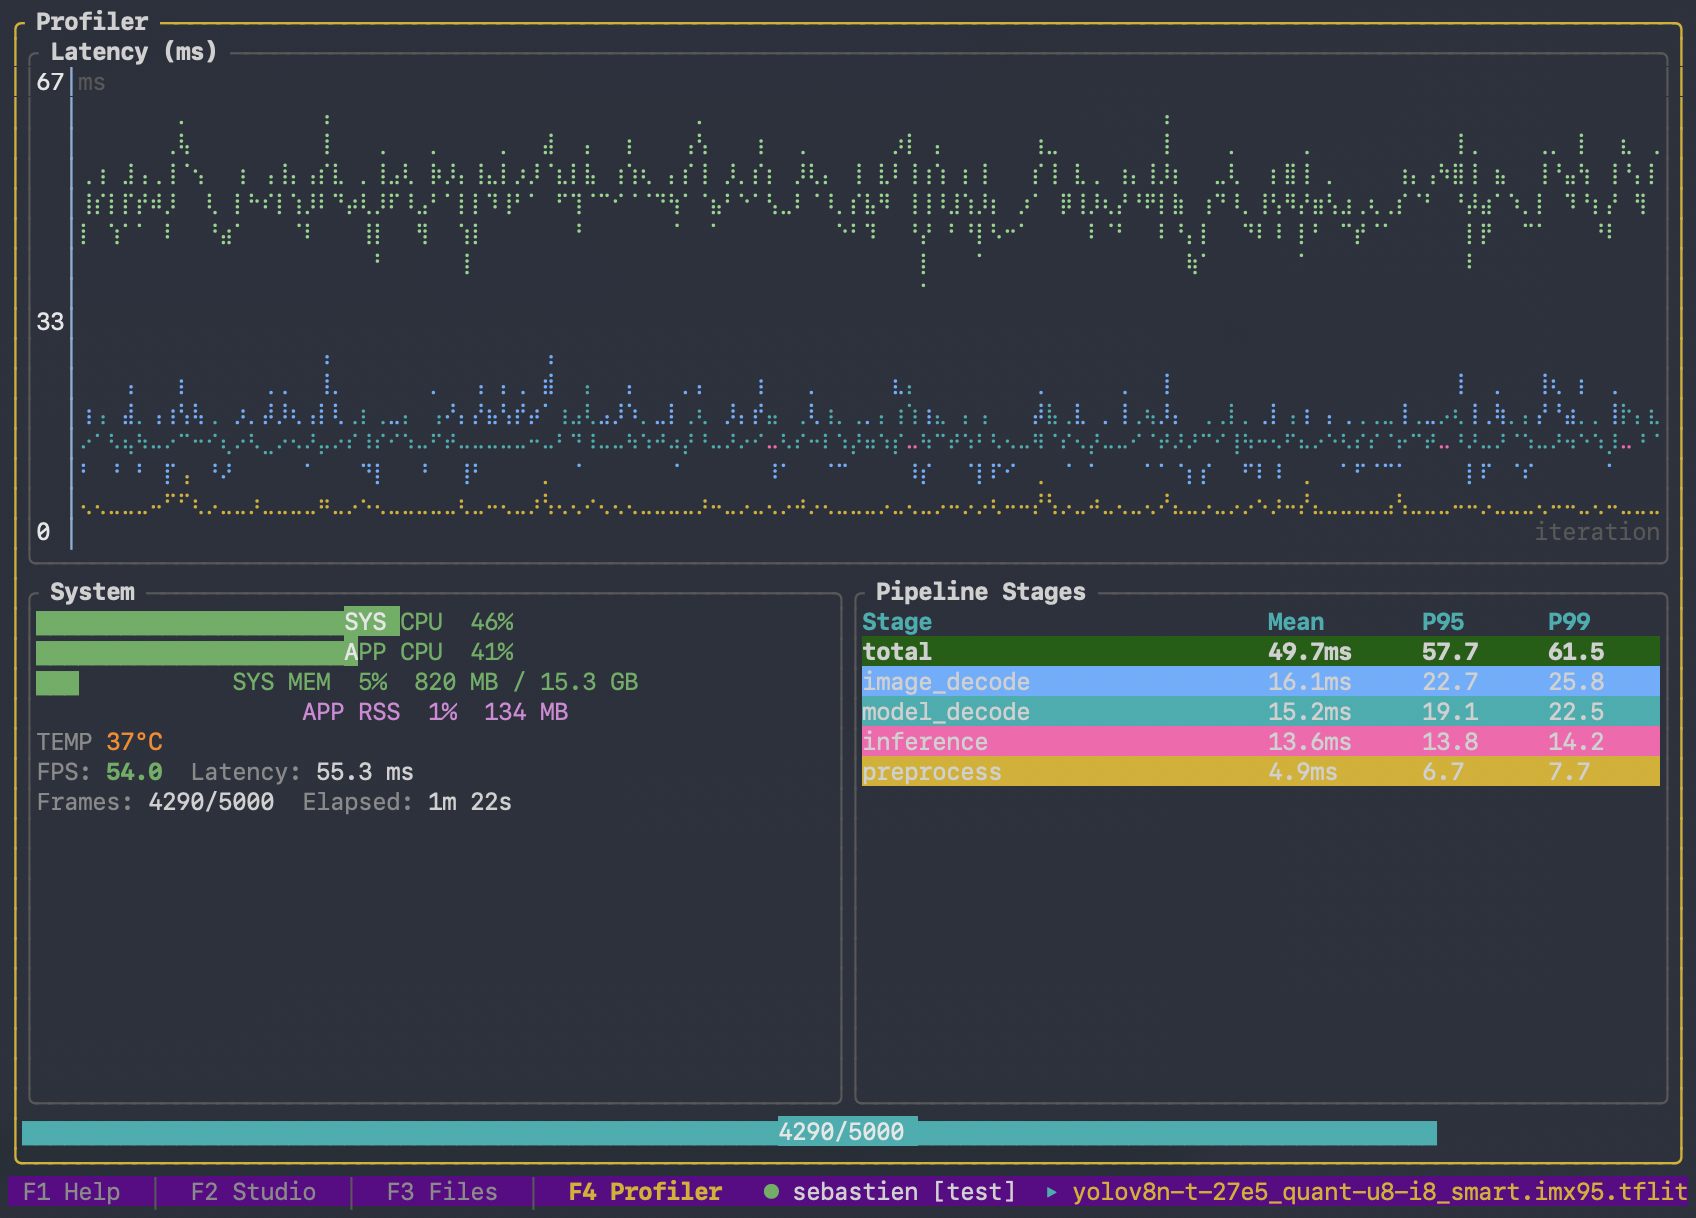
The system-metrics row includes live power draw and on-board temperatures wherever the hardware exposes a sensor. The profiler shows a power meter only for the rails it can actually read — the CPU, GPU, Neural Engine, and DRAM rails on Apple Silicon, and the real board rails on a Linux device with a supported power monitor (for example an NVIDIA Jetson's board-input rail and its per-component breakdown). On a target with no power sensor, no power meters are shown — rather than a row pinned at 0 W — and the session report notes that power is unavailable. Temperatures are read from the platform's thermal zones and hwmon sensors, so the readout reflects what each board actually measures.
When the run finishes, the profiler scores the predictions against the session's ground truth, writes metrics.yaml and the charts beside the trace, and uploads the whole set to Studio. A completion summary then shows the headline numbers and the path to the trace file.
╔═ Profiling Complete ═════════════════════════════╗
║                                                  ║
║  Iterations: 100                                 ║
║                                                  ║
║  Mean:  43.76 ms                                 ║
║  P95:   44.12 ms                                 ║
║  P99:   44.51 ms                                 ║
║  Min:   43.21 ms  Max: 45.03 ms                  ║
║                                                  ║
║  Trace: ./results/trace.pftrace                  ║
║                                                  ║
║  [Enter] Dismiss                                 ║
╚══════════════════════════════════════════════════╝
For a published run the popup also carries the Studio link for the session, widened to fit the full address. Press c to copy that link to the system clipboard rather than selecting it by hand. The same link printed by a CLI run renders as a real clickable hyperlink in terminals that support it.
For the full walkthrough see Validation from the Profiler.
Path B — start from Studio
Create a user-managed validation session in the Studio web UI (instructions). Make a note of the session ID, then on the target:
edgefirst-profiler validate --session-id v-1ce9
The profiler runs headlessly, prints progress bars for download/inference/upload, scores the run, emits a formatted Session Report to stdout, and publishes the results to Studio when the run completes.
Warnings — corrupt images, decoder errors, skipped frames — print to the console as the run proceeds, so a run that quietly drops frames says so at the time. Add -v, -vv, or -vvv to raise the console verbosity to info, debug, or trace.
8. View the results in Studio
Both paths land you at the same place: the validation session card in EdgeFirst Studio. The card shows progress while the run is under way, then surfaces the accuracy charts and trace viewer the profiler published when it finished.
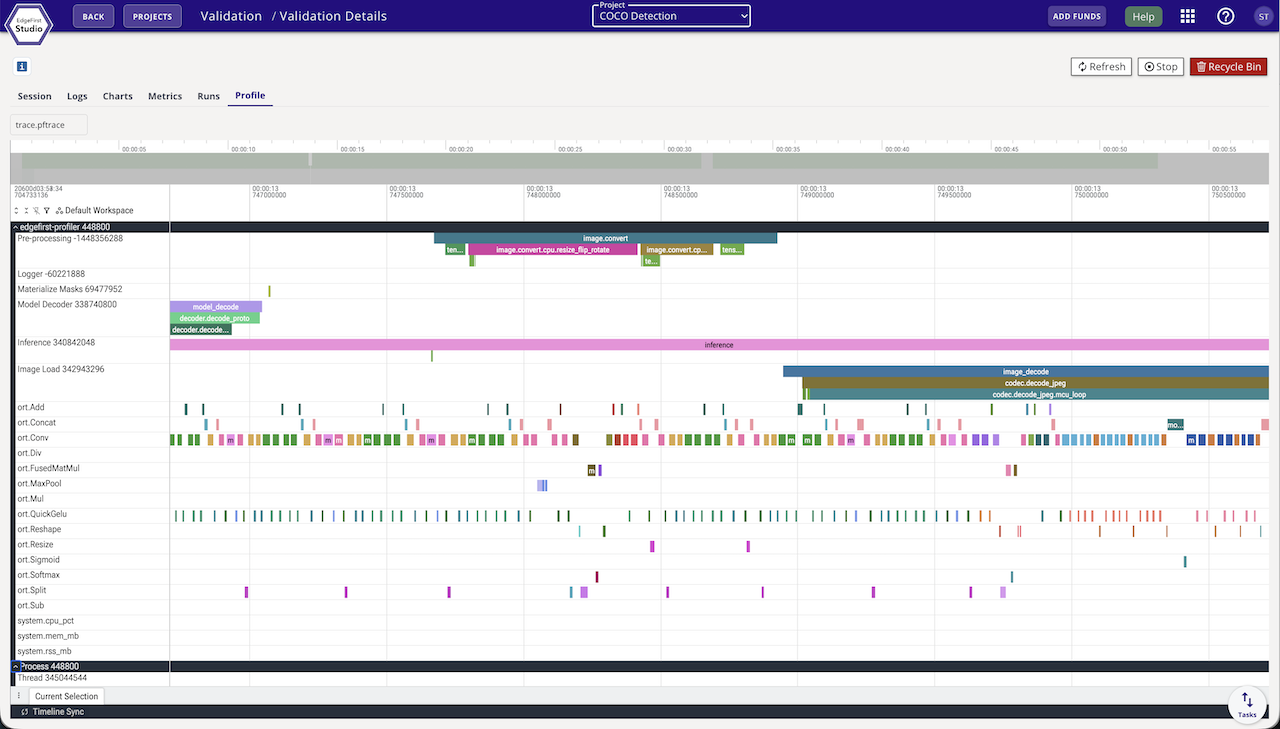
The same numbers are on the target as well: every run writes metrics.yaml next to the trace and prints the metric tables to the console, so you do not have to open Studio to read the result. See Validation and Metrics for what that document holds, and Object Detection Metrics and Segmentation Metrics for the metrics reference.
Next steps
- Profile on edge hardware. The convenience install path works on desktop hosts and most target boards. Embedded targets with NPU/GPU acceleration have a few extra knobs — pick your target from the installation guides.
- Pick the right Studio path. Validation from Studio (session created in the web UI) versus Validation from the Profiler (session created from the TUI).
- Validate without Studio. A local model, a directory of images, and a ground-truth file are enough for a full accuracy run — see Validation and Metrics.
- Run in the cloud. Hand a training session and an artifact to
dispatchand pick the machine it runs on — see Cloud Runs. - Tune the pipeline. The per-stage depths are measured defaults, not universal ones — see Pipelining if you are running on hardware we have not measured or alongside another workload.
- Connect to a different Studio. See Connecting to EdgeFirst Studio for
test/stage/saasserver selection and headless credential handling.