EdgeFirst Studio Integration
The profiler does not require Studio — an offline run against a local model, images, and ground truth computes its metrics entirely on its own. Connecting to Studio adds the validation session: the mechanism that stores a run's published artifacts, surfaces them on Studio's metrics dashboard and trace viewer, and makes runs comparable across models and devices.
This section covers:
- Connecting to Studio — interactive login, headless credential handling, and token-based authentication for CI.
- Validation from Studio — create a validation session in Studio, then point the profiler at the session ID.
- Validation from the Profiler — browse projects and training sessions in the profiler's F2 Studio screen and create the validation session in place.
- Cloud Runs — launch a validation run on Studio-managed cloud hardware, from the Studio launch form or the
dispatchcommand.
Validation sessions, end to end
A validation session is the unit of work that links the device, the model, the dataset, and the Studio results. Every session has a short ID like v-abc123. The session ID is the only piece of state you need to remember.
Validation sessions need a writable project
Creating a validation session requires write access to the Studio project. You cannot validate against the read-only public Sample Project directly — first copy its dataset into a project you own (and add your model), then create the training and validation session there.
sequenceDiagram
    participant Dev as You
    participant Pro as edgefirst-profiler<br/>(on target)
    participant St as EdgeFirst Studio

    Dev->>Pro: validate --session-id v-abc123
    Pro->>St: pull model + dataset
    Pro->>Pro: run pipeline,<br/>compute COCO accuracy metrics,<br/>produce charts
    Pro->>St: publish predictions.parquet, trace.pftrace,<br/>metrics.yaml, platform.yaml, chart JSONs
    St->>St: store artifacts,<br/>surface charts and trace view
    Dev->>St: view charts, compare runs,<br/>open trace
The on-target side does the measuring and the scoring: the profiler runs the pipeline, computes the COCO detection and segmentation metrics on the agent itself, and produces the charts — there is no separate cloud validation step. Studio stores the published artifacts and displays them: the accuracy charts, the per-operator timing visualizations, and the comparison views. The on-device dependency footprint is small — no Python, no pycocotools, even for the metrics computation — and the binary uses edgefirst-hal, multiple inference engines, and the EdgeFirst DMA optimizations for high on-target performance.
A completed session carries the full artifact set:
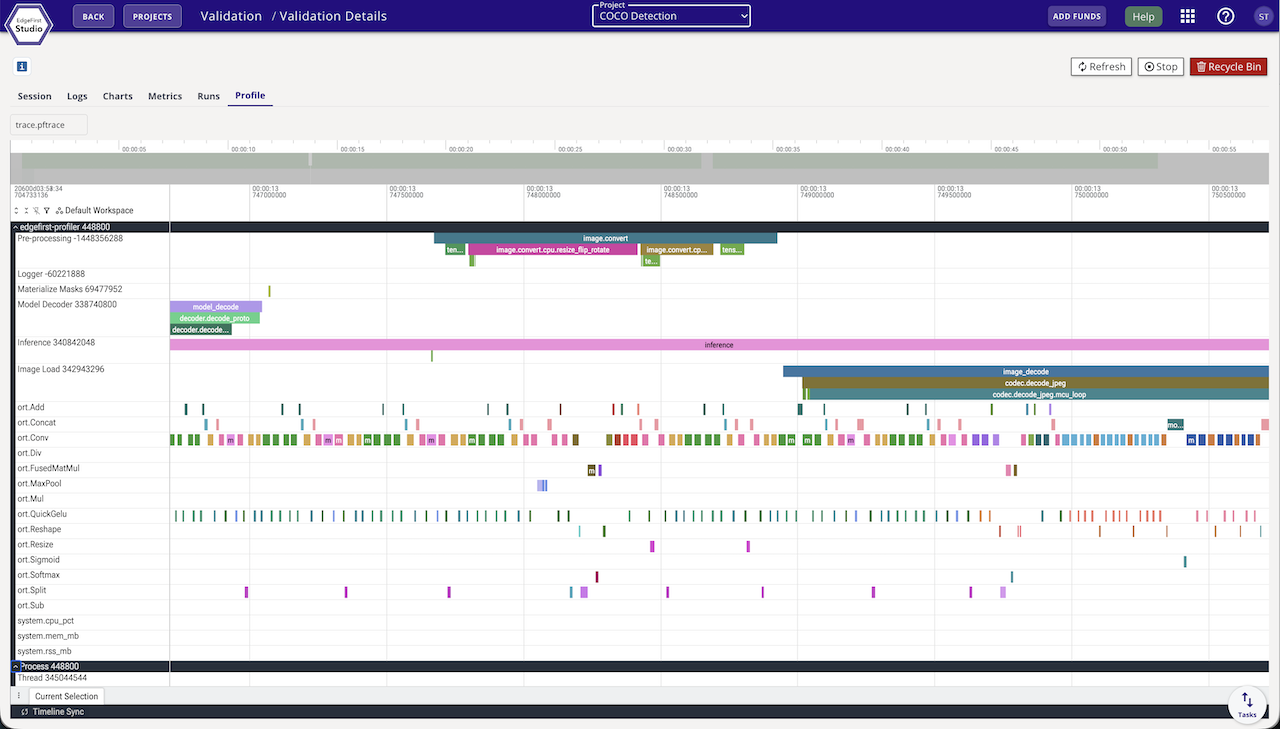
predictions.parquet— the run's predictions (detections, and masks for segmentation models).trace.pftrace— the Perfetto execution trace with pipeline-stage spans, per-operator timing, and system telemetry.metrics.yaml— the accuracy and measured-timing metrics document, the same one an offline run writes locally.platform.yaml— a structured record of the machine that ran it: architecture, processor, accelerator, board, OS, and memory.- Chart JSONs — accuracy, timing and throughput, device execution-timing, and system-telemetry charts, produced by the profiler and rendered by Studio.
What you see in Studio
When the validation session finishes, the session card surfaces accuracy charts, a per-frame timing summary, and the trace viewer.
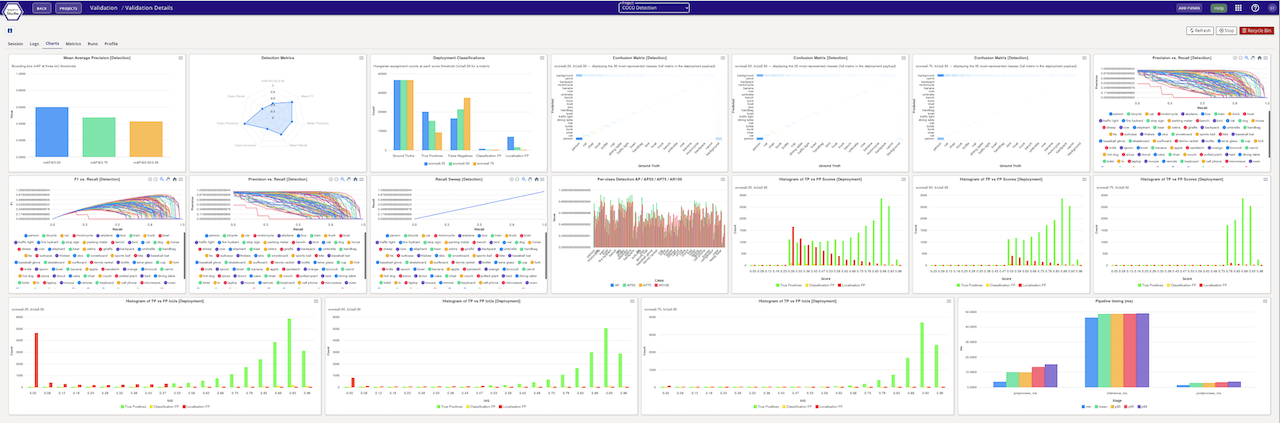
See Object Detection Metrics and Segmentation Metrics for the metrics reference.