Profiling the Middleware
The EdgeFirst Perception Middleware services carry timing instrumentation which can be enabled at runtime, without rebuilding or redeploying anything. With it enabled a service reports the time spent in each stage of its work, the boundaries between frames, and a handful of scalar series such as frame rate and bitrate. The Tracy profiler is used to view this data live from a workstation while the device runs.
This is the tool to reach for when a service is slower than expected and you need to know which part of it is slow. It answers questions like which stage of the camera pipeline is consuming the frame budget, or how long the radar cube takes to decode before fusion can use it.
Tracy and the EdgeFirst Profiler are different tools
Tracy profiles a running middleware service on the device and shows the result live. The EdgeFirst Profiler measures model inference pipelines, writes a trace file, and publishes results to EdgeFirst Studio. They serve different purposes and the workflows here do not apply to the Profiler.
Which services are instrumented
Eight services carry instrumentation. The recorder and websrv services do not, so enabling profiling will not produce anything for them.
| Service | Covered |
|---|---|
camera |
Capture, resize, H.264 and JPEG encode, and publish paths |
model |
Inference and message construction |
fusion |
Both model paths, cube decoding, camera load, and publish |
radarpub |
Ethernet and CAN ingest paths |
lidarpub |
Sensor driver and the clustering thread |
imu |
Frame marks and plots |
navsat |
Frame marks and plots |
replay |
Frame marks, and the stream_h264, stream_jpeg, and publish paths |
recorder, websrv |
Not instrumented |
Match the Tracy version first
Tracy's network protocol is version locked. A profiler whose version does not match the client built into the service will refuse to connect, and the error it reports does not make the cause obvious. Check this before anything else.
The services require Tracy v0.14.1. Installing that version is the whole of the requirement, and the next section links the downloads for it directly.
Install the Tracy profiler
Prebuilt binaries are published for each platform on the Tracy releases page. Download the archive for your workstation, unpack it, and run the profiler from it. There is nothing to install on the device.
| Platform | Download |
|---|---|
| Windows | windows-0.14.1.zip |
| Linux | linux-0.14.1.zip |
| macOS | macos-0.14.1.zip |
The archives contain both the profiler and the tracy-capture tool used for headless capture.
Tracy publishes a thorough manual covering the interface in far more depth than this page, refer to the Tracy Profiler manual for the full reference.
Enable profiling on the device
The instrumentation is compiled into every service but stays inert until it is switched on. How you switch it on depends on whether the services are managed by systemd or launched by hand.
System-mode services
On Torizon for Maivin the services run as systemd units and each reads an EnvironmentFile under /etc/default/, so enabling profiling is a configuration change and a restart. Set TRACY to true in the file for the service you want to profile and restart the unit. For the camera service:
sudo sed -i 's/^TRACY=.*/TRACY="true"/' /etc/default/camera
sudo systemctl restart camera
To disable Tracy you would use
sudo sed -i 's/^TRACY=.*/TRACY="false"/' /etc/default/camera
sudo systemctl restart camera
The same applies to model, fusion, radarpub, imu, navsat, and replay.
The lidarpub setting ships commented out
/etc/default/lidarpub ships the line as #TRACY="false". Uncommenting it on its own leaves profiling disabled, so replace it with TRACY="true", or add that line separately, before restarting the unit.
User-mode services
Where the services are launched from the command line with the EdgeFirst Launcher there is no EnvironmentFile. Pass --tracy to the service instead:
edgefirst-camera --mirror none --tracy &
Every instrumented service accepts the flag, and TRACY=true in the environment does the same thing.
Refer to the platform Configuration section for how these files are structured and how they interact with the packaged defaults.
Leaving the setting enabled on a device is close to free. The client collects nothing at all until a profiler actually attaches, so an enabled service with nobody watching pays only for an idle listener.
Connect
Launch tracy-profiler on your workstation. It discovers the services which have profiling enabled on the network and lists them, each entry naming the device address and the service. Select the one you want and the live timeline opens.
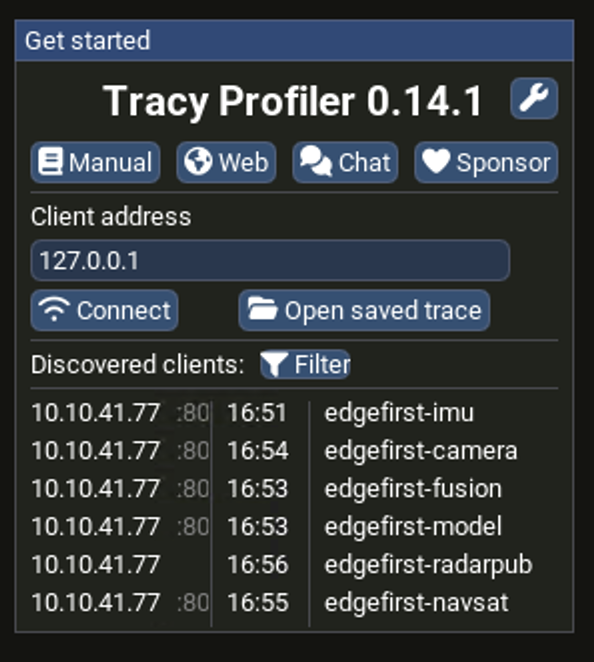
Discovery works when the workstation and the device are on the same network. Each service is a separate entry in the list, so a device running several profiled services appears several times, and one profiler window attaches to one service at a time.
Capture without a profiler attached
For unattended runs, or to keep a record of a session rather than watch it live, tracy-capture records to a file which can be opened later.
tracy-capture -a <device-address> -o run.tracy
tracy-capture -a <device-address> -s 60 -o run.tracy
tracy-capture -a <device-address> -p 8086 -f -o run.tracy
The first records until interrupted, the second stops after sixty seconds, and the third names the port explicitly and overwrites an existing file. It reports bandwidth and compression ratio while recording.
tracy-capture ships in the same archive as the profiler and is subject to the same version matching. Open the resulting .tracy file with the profiler to review it.
What you see
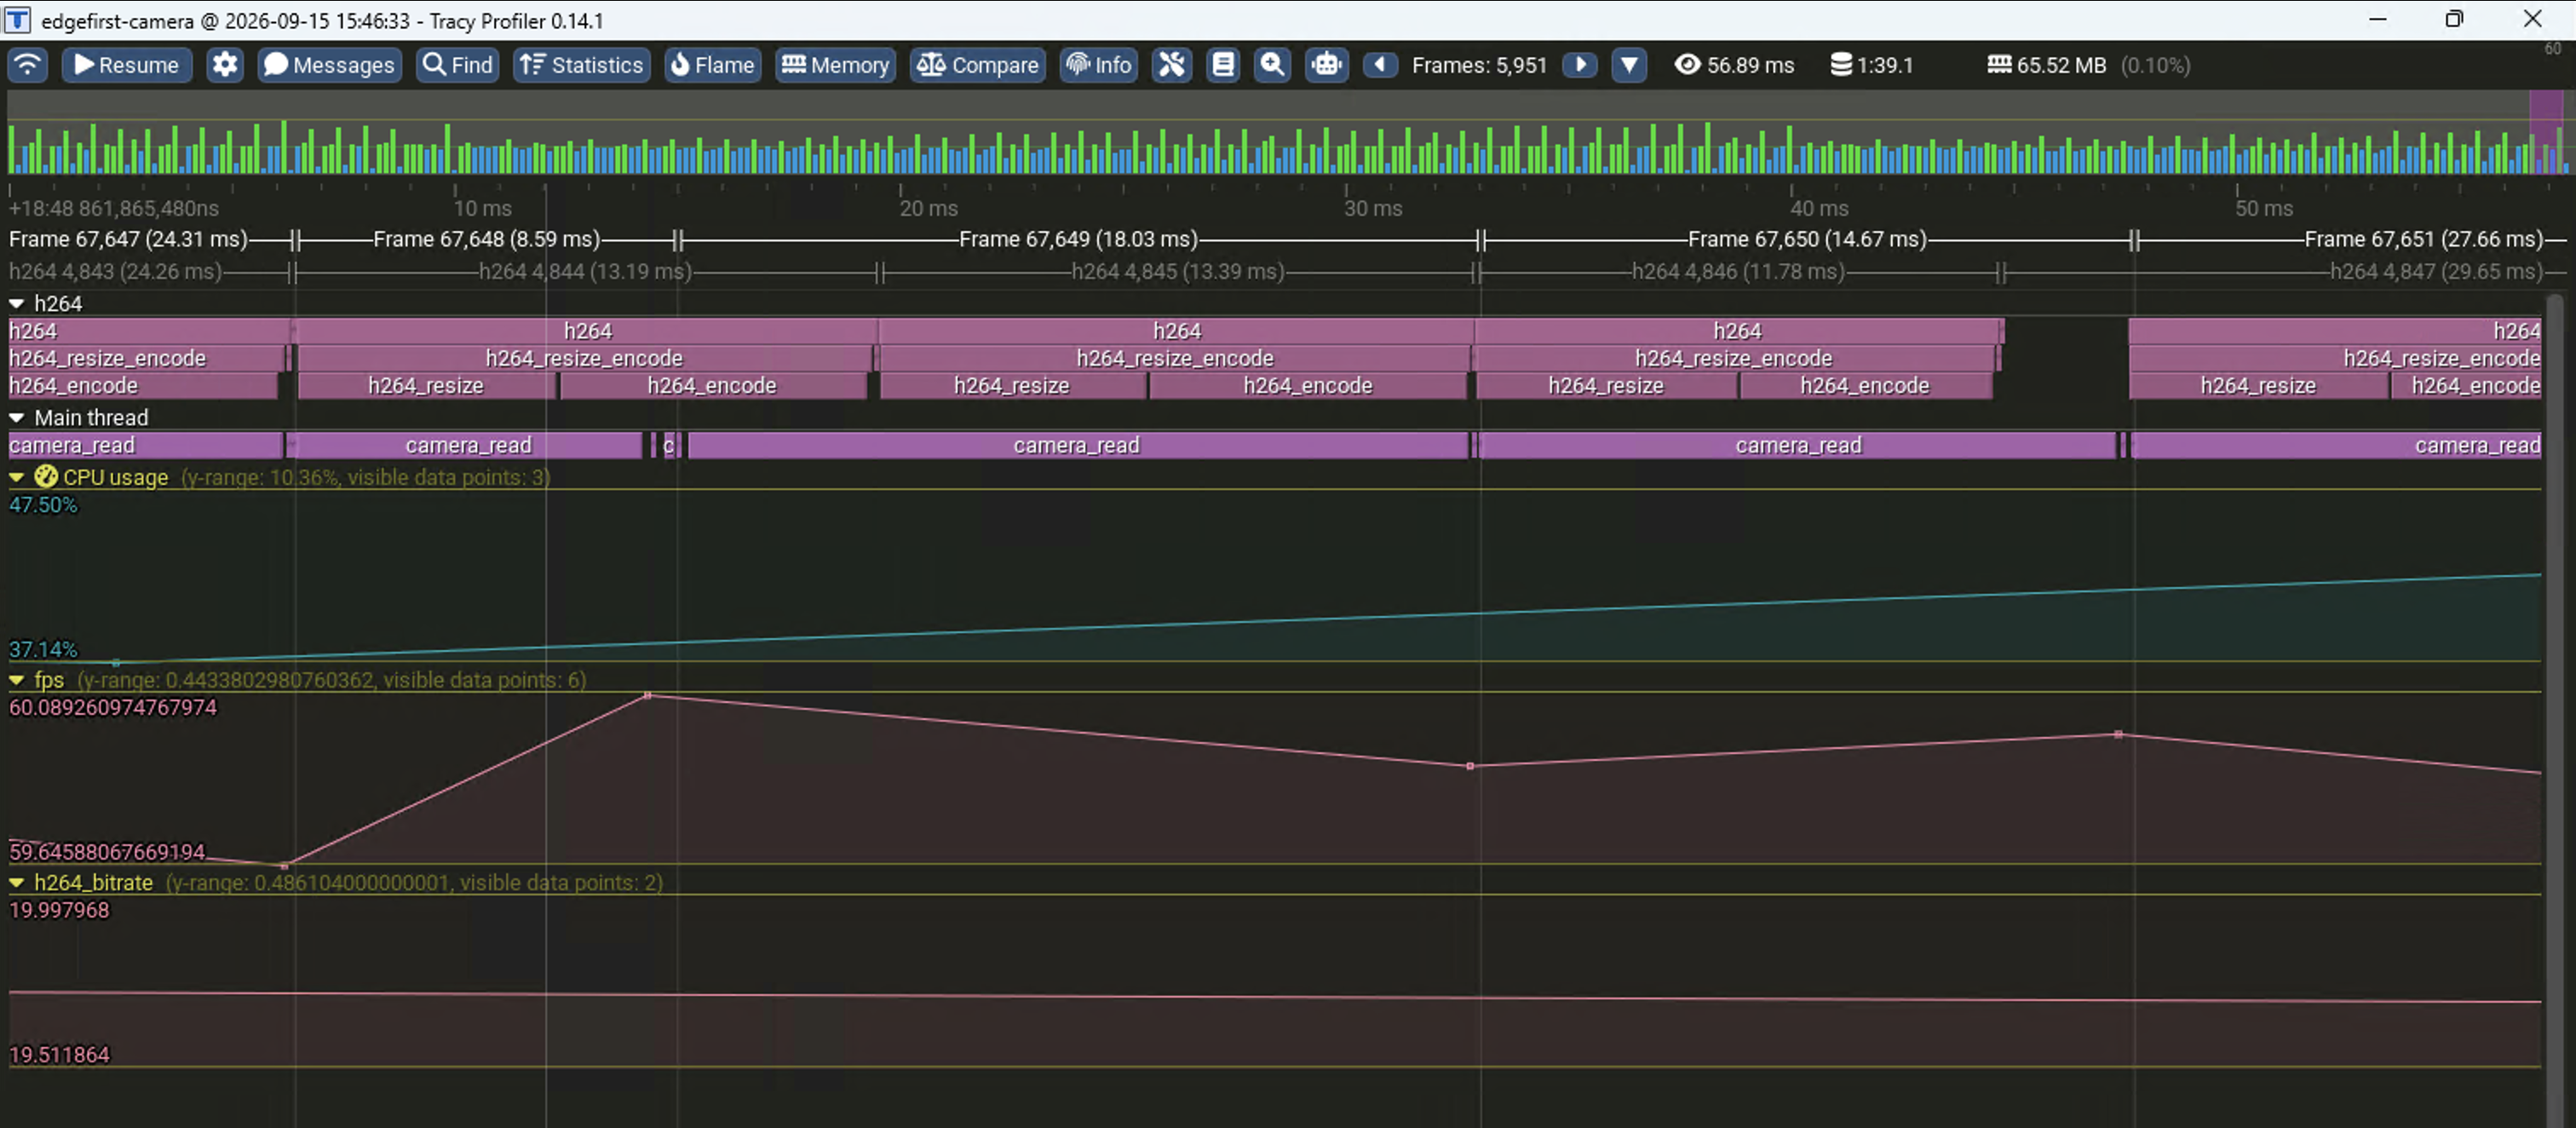
| View | Populated by |
|---|---|
| Frame timeline | The main loop of each service |
| Secondary frames | The h264, jpeg, and h264_tile paths in the camera service, and the model path in fusion |
| Zones | The instrumented stages. On the camera service these are camera_read, camera_publish, camera_frame_serialize, h264, h264_resize, h264_encode, h264_resize_encode, and h264_publish |
| Plots | Scalar series, fps and h264_bitrate on the camera service, alongside Tracy's own CPU usage plot |
| Messages | The service log output, which shares the same instrumentation as the zones |
Zone volume is filtered by the service log level. Raising RUST_LOG on a busy service increases the number of zones it reports, and lowering it reduces them, which is the knob to reach for when the timeline is too dense to read.
Finding the expensive stage
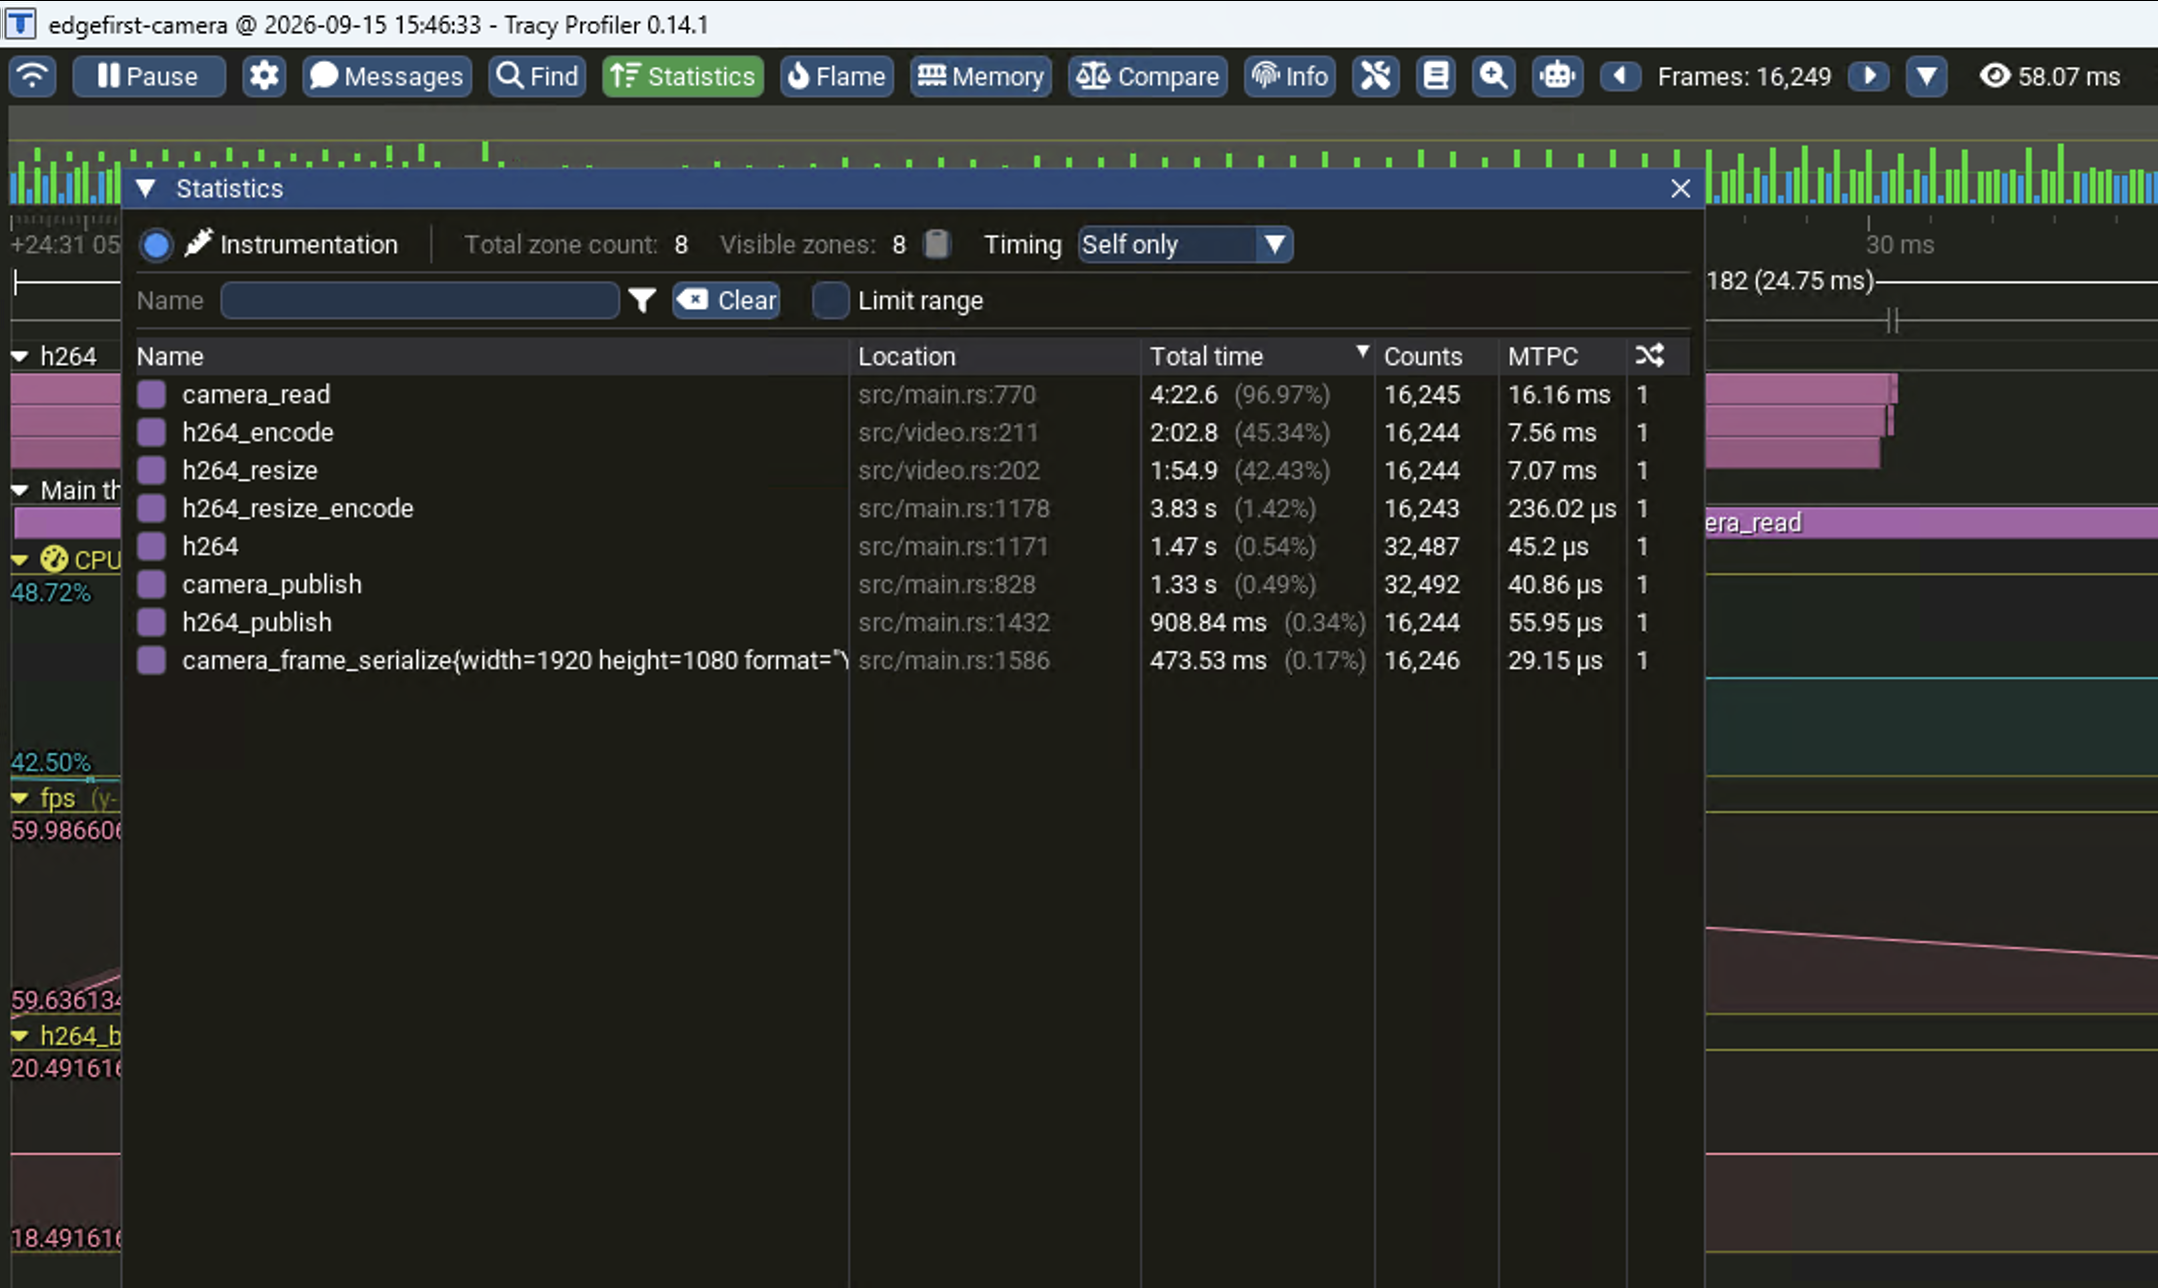
Reading the timeline tells you what a frame did, but not what dominates over a run. The Statistics window ranks every zone by total time, with its source location and how many times it ran, which is the quickest way to find where a service actually spends itself.
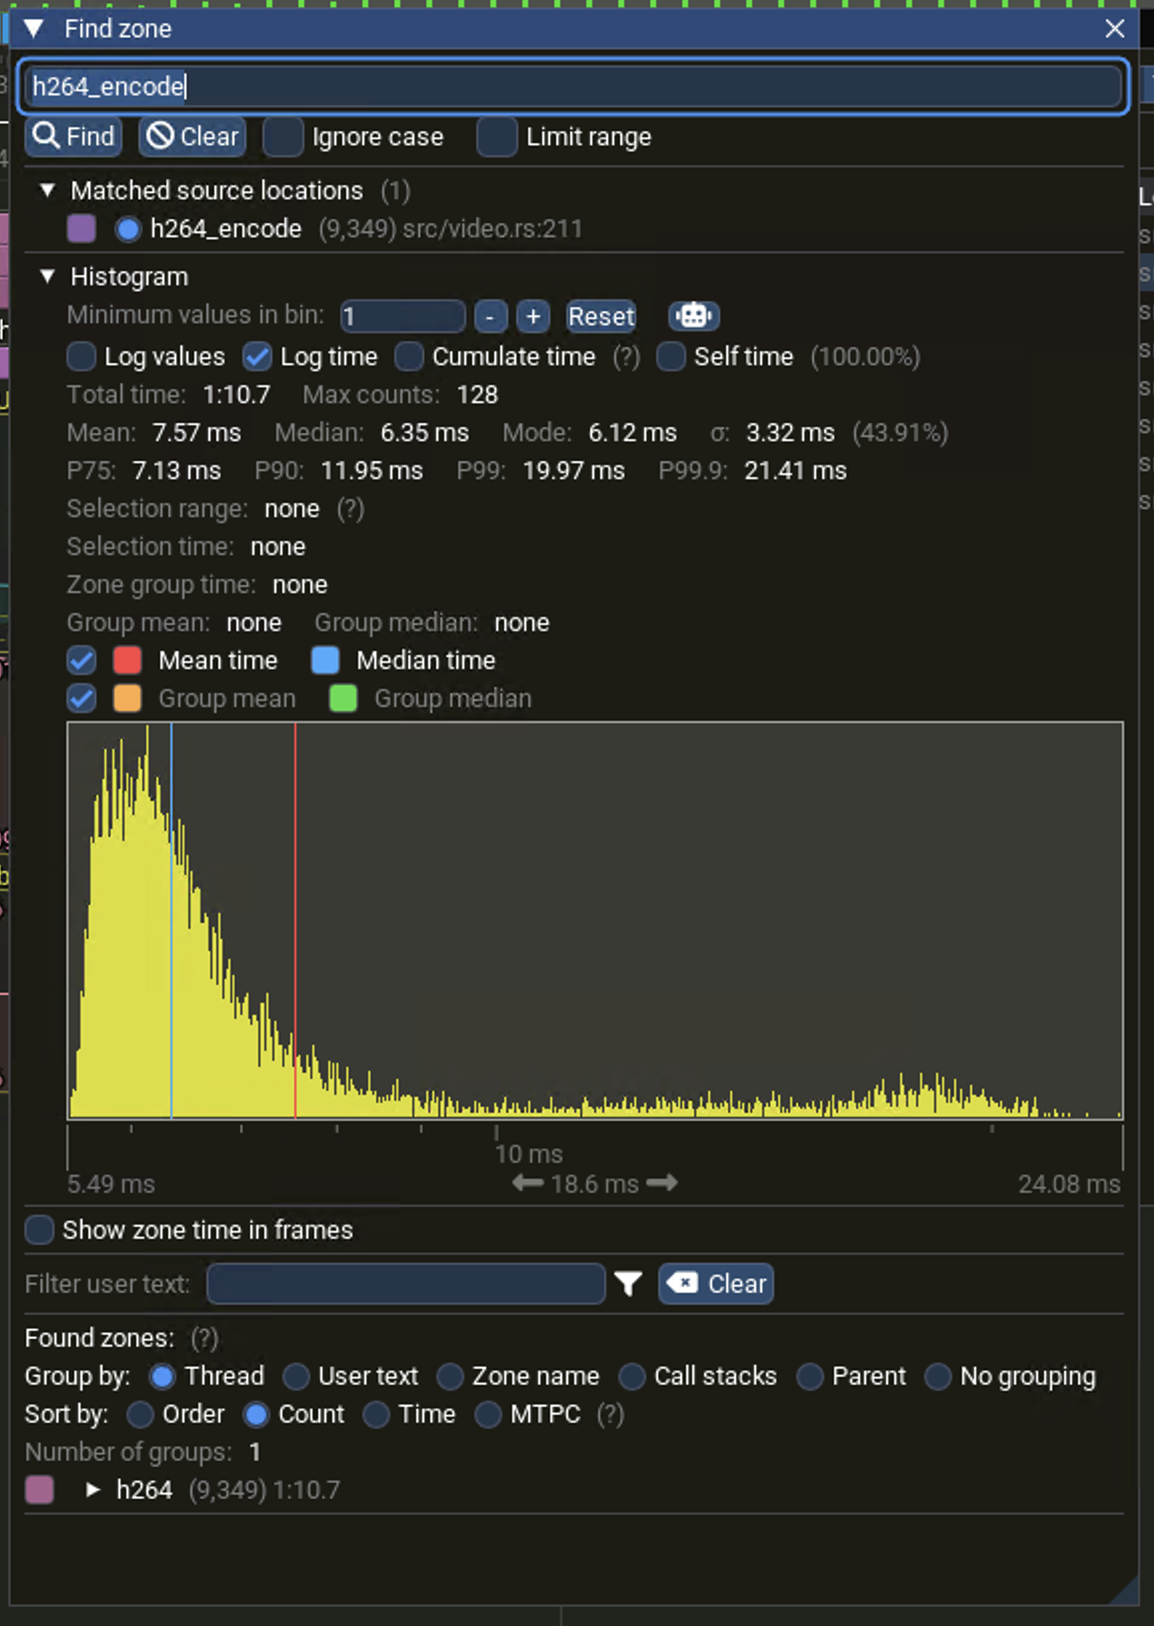
Once a zone looks interesting, Find zone plots the distribution of its durations. Mean, median, and the P99 tail separate a stage which is uniformly slow from one which is usually fast but occasionally stalls, a distinction the timeline alone hides.
What stays empty
Tracy can also show sampled call stacks and memory allocation tracking, but both stay empty against the shipped services. They require a service binary built specifically for it, which the packaged builds are not. The zones, frame marks, and plots above are what the shipped services provide, and they are what most investigations need.
Limits
- Nothing is saved automatically. A live session is kept only in memory until you save it, either with Save trace in the profiler or by recording with
tracy-capturefrom the start. Profiling data does not reach an MCAP recording or EdgeFirst Studio. - One service at a time per profiler. Profiling several services concurrently needs several profiler instances.
- Version locked, as described above.
- One process per session. A Tracy session shows a single service. Relating a camera zone to the model zone which consumed that frame is done through the message timestamps in a recording, not in Tracy.
- No transport measurement. Tracy shows time spent inside a service. It does not measure the time a message spends travelling between services.